728x90
What is Telemetry
• Remote Measure
• Third Party Monitoring
• Not a new concept
But Doing it new way
Docker, KVM, AWS, Azure
Service Visibility is the key in cloud
- Visibility is often accomplished via post facto application of agent-based monitoring tools
- Agent-based monitoring tool don’t understand business value (not dynamic)
- Determining an application’s health often requires complex logic
- Traceability of an application is difficult( or impossible) to accomplish with OTS solutions
< 구조 >

텔레메트리 분류
ingest(데이터 받기) > Store(저장) > Analysis(분석) > Present(보여줌)
1. ingest
: Prometheus for Metric

: fluentd for logging (또는 Apache Flume)

2. Store
: TSDB for Metric
Prometheus
- simple
- has its own SQL (PROMQL) : easy for use
- no clustering or high availability
OpenTSDB • powerful
- clustering and high availability
- complicated ( based on hbase, Hadoop)
: key/value for logging
Elastic Search (많이 씀)
- simple, support scale-out
- support GUI (kibana)
- fast, realtime support
- DSL based search
3. Analysis : it’s not quite simple

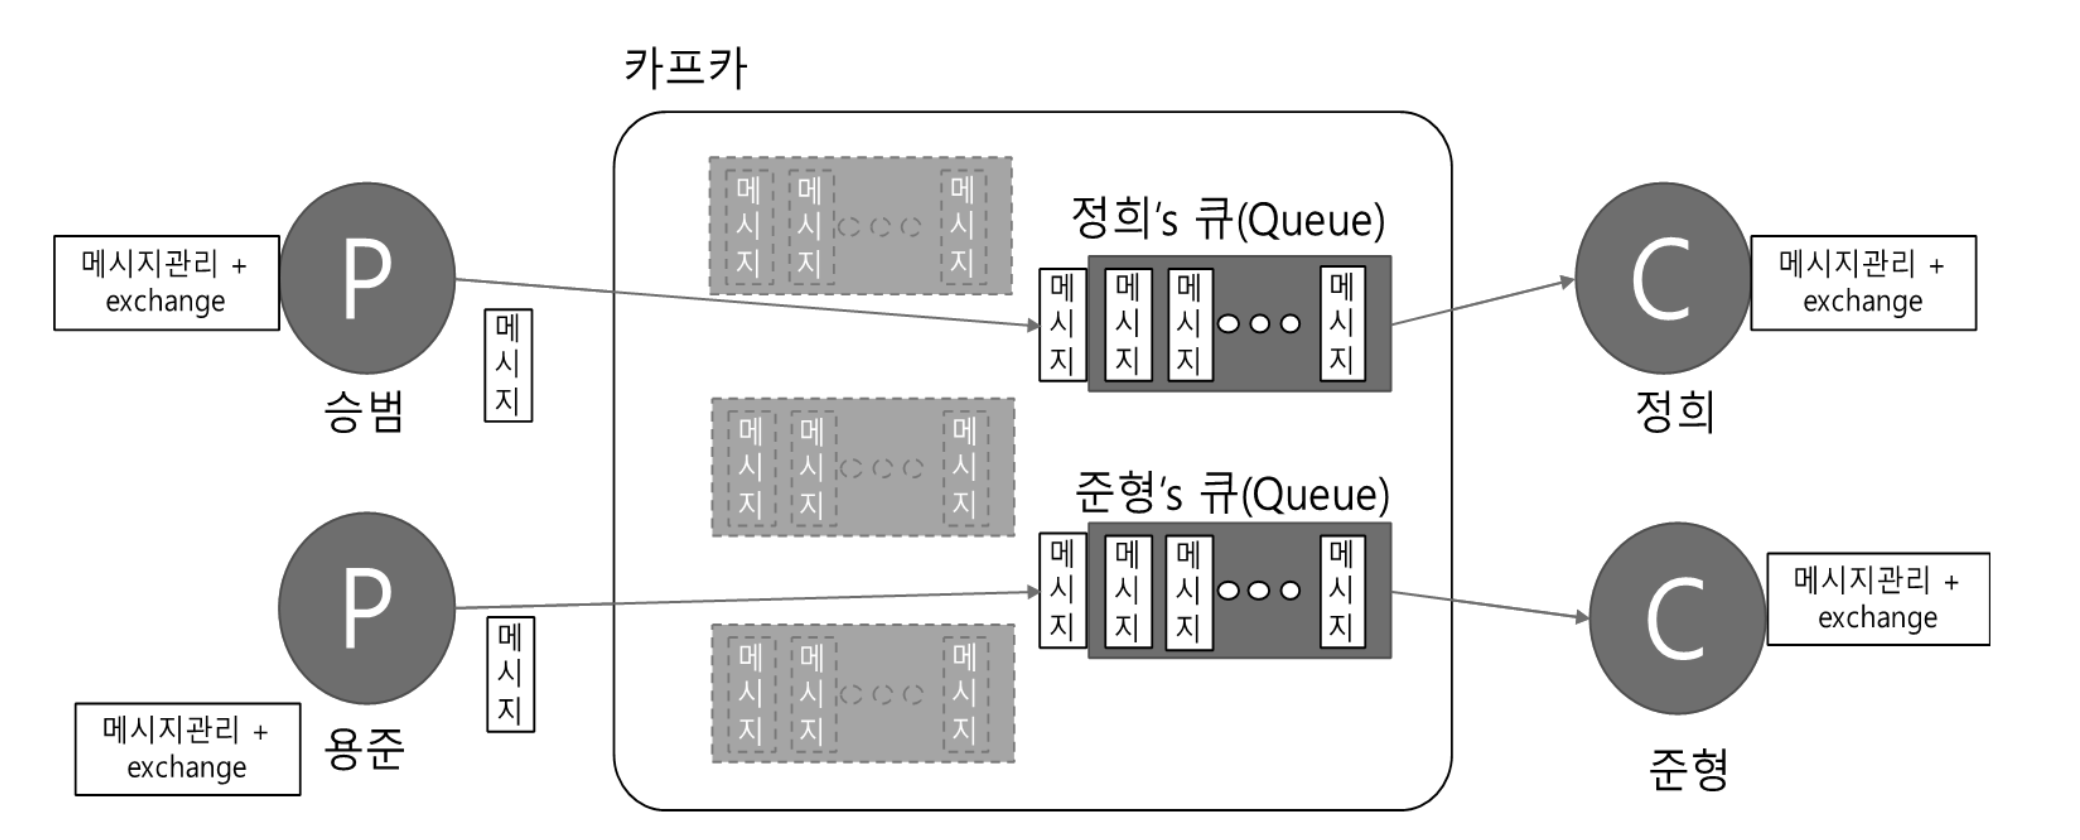
Message queue: kafka
- 관리 부분을 발신/수신자에게 부담해버림
- 카프카 내부에선 큐만 관리 -> 빠를 수 밖에 없음


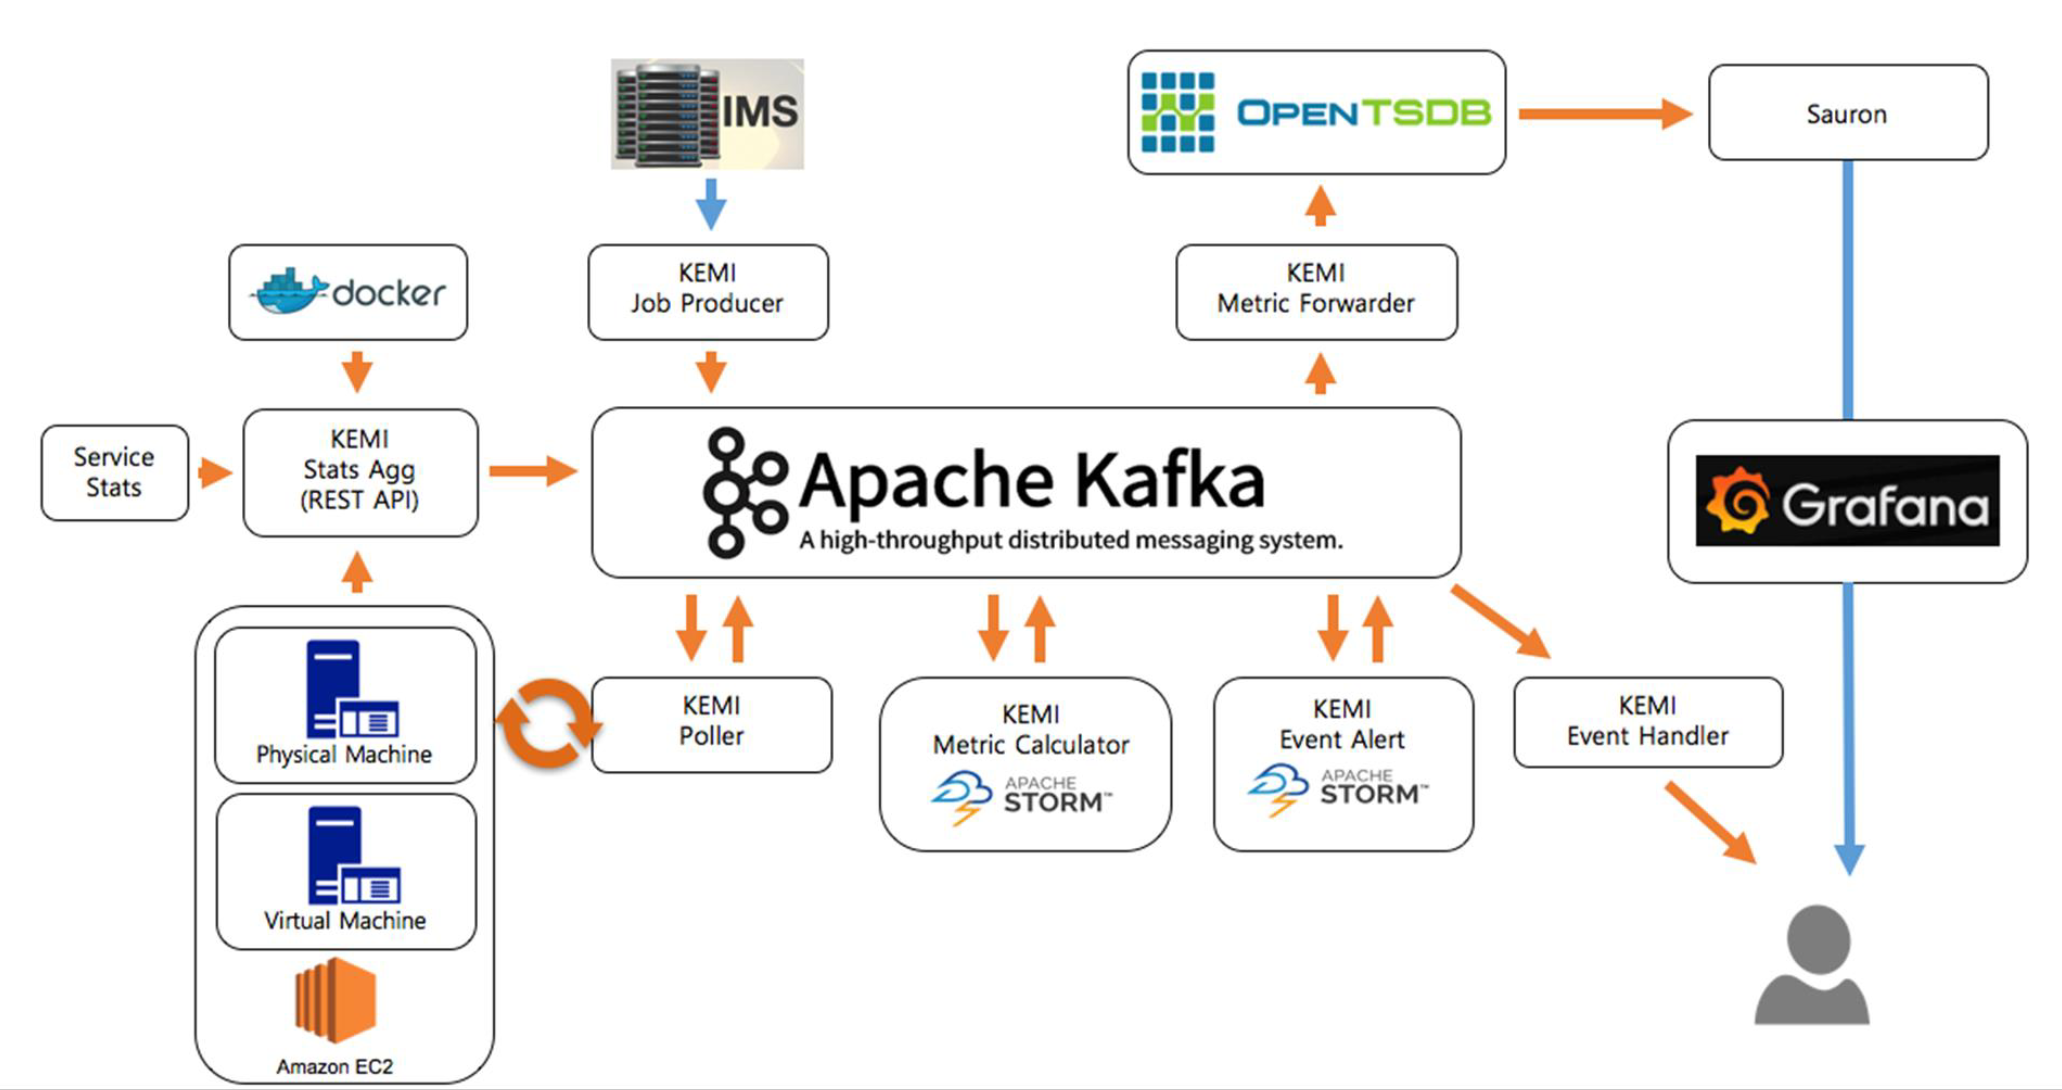
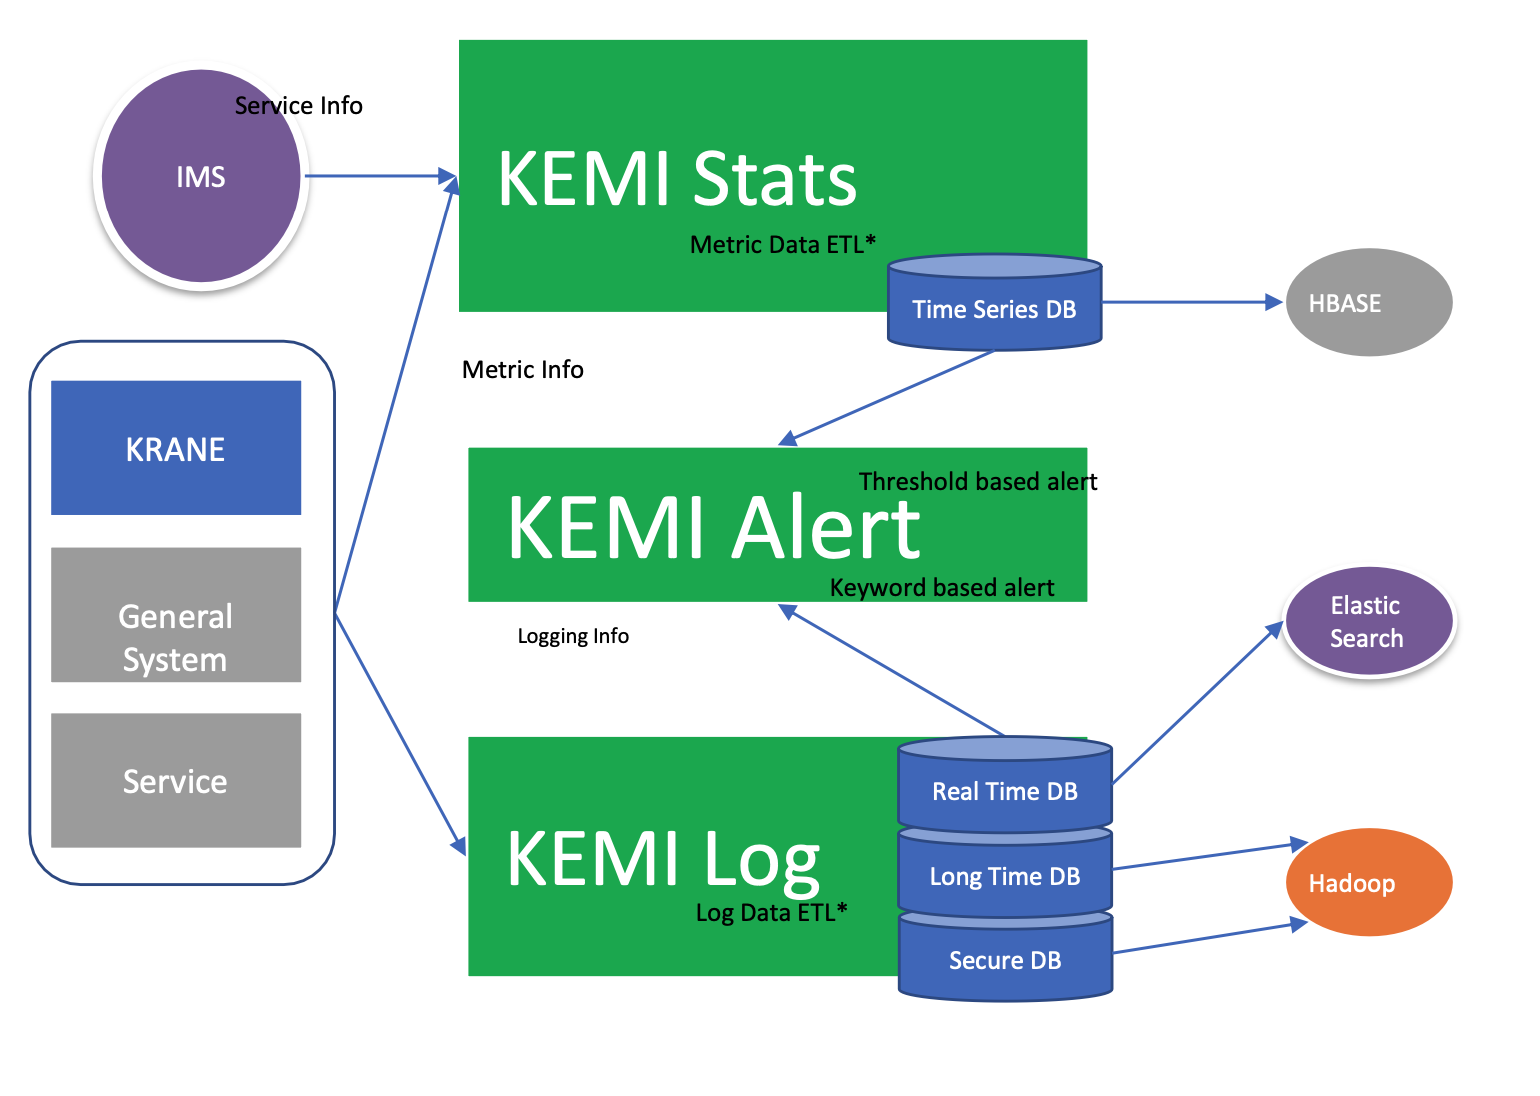
<여러 회사들의 예시>
Metric integration: kakao’s kemi stats

logging integration case: kemi log

Kakao’s case

728x90
'Network > [Cloud]' 카테고리의 다른 글
| [Cloud] 도커 기본 명령어 (0) | 2022.12.05 |
|---|---|
| [Cloud] 도커란? (0) | 2022.12.05 |
| [Cloud] 2. 클라우드 서버 가상화 (Server virtualizations) (1) | 2022.11.26 |
| [Cloud] 1. 클라우드 컴퓨팅이란? (0) | 2022.11.25 |