학습데이터를 변형시켜 마치 다른 학습데이터처럼 만들기 : 한장의 사진으로 여러장의 학습데이터를 만들 수 있다.


import cv2
import matplotlib.pyplot as plt
import numpy as np

image = cv2.imread("image02.jpeg")
image = cv2.cvtColor(image, cv2.COLOR_BGR2RGB)
# #### rotation ####
# angle = 30

# h, w = image.shape[:2]
# center = (w//2, h//2)
# M = cv2.getRotationMatrix2D(center, angle, 1.0)
#     # getRotationMatrix2D(중심 좌표, 회전 각도, 크기 변환 비율)

# rotated_img = cv2.warpAffine(image, M, (w, h))
#                 # warpAffine(원본 이미지, 회전 행렬, 이미지 크기)

# plt.imshow(image)
# plt.show()

# plt.imshow(rotated_img)
# plt.show()
# #### rotation ####

#### zoom ####
# h, w = image.shape[:2]

# zoom_scale = 4 # 이미지 확대/축소 배율
# enlarged_img = cv2.resize(image, (w*zoom_scale, h*zoom_scale), interpolation=cv2.INTER_CUBIC)
#             # resize(원본 이미지, (최종 너비, 최종 높이), 이미지 보간 방법 (ex: cv2.INTER_CUBIC))
# center = [enlarged_img.shape[0] // 2, enlarged_img.shape[1] // 2]
# cut_half = 300
# zoomed_img = enlarged_img[center[0]-cut_half:center[0]+cut_half, center[1]-cut_half:center[1]+cut_half]
# plt.imshow(zoomed_img)
# plt.show()
#### zoom ####


#### shift ####

# shift = (0, 50)
# M = np.float32([
#     [1, 0, shift[0]],
#     [0, 1, shift[1]]
# ])
# # 이동 행렬: 좌측 2x2 -> 회전 행렬 (현재 단위행렬), 우측 1열: 이동 행렬 (x 변위, y 변위)

# shifted_img = cv2.warpAffine(image, M, (image.shape[1], image.shape[0]))
# plt.imshow(shifted_img)
# plt.show()
#### shift ####

#### flip ####
# flipped_img_updown = cv2.flip(image, 0) # 상하반전
# flipped_img_leftright = cv2.flip(image, 1) # 좌우반전
# flipped_img_lr_other = cv2.flip(image, -1) # 상하 & 좌우반전

# plt.imshow(image)
# plt.show()
# plt.imshow(flipped_img_updown)
# plt.show()
# plt.imshow(flipped_img_leftright)
# plt.show()
# plt.imshow(flipped_img_lr_other)
# plt.show()
#### flip ####

#### salt-and-pepper noise ####
# noise = np.zeros(image.shape, np.uint8) # uint8 = unsigned int 8-bit (부호 없는 1바이트 정수)
# cv2.randu(noise, 0, 255)
# black = noise < 30 # [True, True, False, False, False, ...] 형태의 Mask 생성
# white = noise > 225
# noise[black] = 0
# noise[white] = 255

# noise_b = noise[:, :, 0] # image.shape (h, w, c) -> h*w*c -> color channel : B, G, R
# noise_g = noise[:, :, 1]
# noise_r = noise[:, :, 2]
# noisy_img = cv2.merge([
#     cv2.add(image[:, :, 0], noise_b),
#     cv2.add(image[:, :, 1], noise_g),
#     cv2.add(image[:, :, 2], noise_r)
# ])

# plt.imshow(image)
# plt.show()
# plt.imshow(noisy_img)
# plt.show()
#### salt-and-pepper noise ####


#### Gaussian Noise ####
# mean = 0
# var = 100
# sigma = var ** 0.5

# gauss = np.random.normal(mean, sigma, image.shape)
# gauss = gauss.astype('uint8')

# noisy_img = cv2.add(image, gauss)

# plt.imshow(noisy_img)
# plt.show()
#### Gaussian Noise ####


#### 색조 변경 ####
# RGB , HSV 
# hsv_img = cv2.cvtColor(image, cv2.COLOR_RGB2HSV)
# hue_shift = 30
# hsv_img[:, :, 0] = (hsv_img[:, :, 0] + hue_shift) % 180
# rgb_img = cv2.cvtColor(hsv_img, cv2.COLOR_HSV2RGB)

# plt.imshow(image)
# plt.show()
# plt.imshow(rgb_img)
# plt.show()
#### 색조 변경 ####


#### 색상 변환 ####
# hsv_img = cv2.cvtColor(image, cv2.COLOR_RGB2HSV)

# # hsv[h, w, c]
# hsv_img[:, :, 0] += 50 # Hue -> 50도 증가
# hsv_img[:, :, 1] = np.uint8(hsv_img[:, :, 1] * 0.5)  # 채도
# hsv_img[:, :, 2] = np.uint8(hsv_img[:, :, 2] * 1.5)  # 밝기

# # imshow <- BGR / RGB 로 강제로 디코딩
# rgb_img = cv2.cvtColor(hsv_img, cv2.COLOR_HSV2RGB)
# plt.imshow(rgb_img)
# plt.show()
#### 색상 변환 ####


#### 이미지 크롭 ####
# x, y, w, h = 300, 300, 200, 200  # (100, 100) 좌표에서 (200 * 200) 크기로 자를 것임
# crop_img_wide = image[y-h:y+h, x-w:x+w] # (x, y) 를 중심으로 2w, 2h 크기로 자름
# crop_img_lt = image[y:y+h, x:x+w] # (x, y) 를 기점으로 (w, h) 만큼 오른쪽 아래로 간 크기로 자름

# plt.imshow(image)
# plt.show()
# plt.imshow(crop_img_wide)
# plt.show()
# plt.imshow(crop_img_lt)
# plt.show()
#### 이미지 크롭 ####

#### warpAffine ####
# x_diff = 50
# y_diff = 100
# h, w, c = image.shape
# M = np.float32([
#     [1, 0, x_diff],
#     [0, 1, y_diff]
# ]) # x축으로 50, y 축으로 100 이동하는 병진이동행렬
# shifted_img = cv2.warpAffine(image, M, (w, h))

# M = cv2.getRotationMatrix2D((w // 2, h // 2), 45, 1.0)
# rotated_img = cv2.warpAffine(image, M, (w, h))

# M = cv2.getRotationMatrix2D((w // 2, h // 2), 0, 0.5)
# halfed_img = cv2.warpAffine(image, M, (w, h), flags=cv2.INTER_AREA) # 가장자리를 검은색으로 칠한, 원본 이미지 크기와 같은 축소 이미지
# croped_img = halfed_img[h//2 - h//4 : h//2 + h//4, 
#                         w//2 - w//4 : w//2 + w//4] # 가장자리를 잘라낸 이미지

# resized_img = cv2.resize(image, (w//2, h//2), interpolation=cv2.INTER_AREA)
# plt.imshow(image)
# plt.show()
# plt.imshow(shifted_img)
# plt.show()
# plt.imshow(rotated_img)
# plt.show()
# plt.imshow(resized_img)
# plt.show()
# plt.imshow(halfed_img)
# plt.show()
# plt.imshow(croped_img)
# plt.show()
#### warpAffine ####

#### blurring ####
# blur_img = cv2.GaussianBlur(image, (5, 5), 5)

# plt.imshow(blur_img)
# plt.show()
#### blurring ####

#### adaptive threshold ####
# img_gray = cv2.cvtColor(image, cv2.COLOR_RGB2GRAY)

# thresh = cv2.adaptiveThreshold(img_gray, 255, cv2.ADAPTIVE_THRESH_MEAN_C, cv2.THRESH_BINARY, 11, 2)
# # ADAPTIVE_THRESH_MEAN_C: 적응형 임계값 처리, 임계값 기준을 평균치를 사용함
# # 인자 11: 블록 크기, 11x11 블록으로 이미지를 나눈 후 해당 영역
# plt.imshow(img_gray, 'gray')
# plt.show()
# plt.imshow(thresh, 'gray')
# plt.show()
#### adaptive threshold ####


#### 색온도 보정 ####
# org_img = image.copy()
# balance = [0.8, 0.7, 0.8]

# for i, value in enumerate(balance):
#     if value != 1.0:
#         org_img[:, :, i] = cv2.addWeighted(org_img[:,:,i], value, 0, 0, 0)
#                             # addWeighted: src에 대해 value만큼의 가중치로 색온도 조절

# plt.imshow(org_img)
# plt.show()
#### 색온도 보정 ####


#### 모션 블러 ####
# kernal_size = 15
# kernal_direction = np.zeros((kernal_size, kernal_size))
# kernal_direction[int((kernal_size)//2), :] = np.ones(kernal_size)
# kernal_direction /= kernal_size # 커널의 합이 1이 되도록
# kernal_matrix = cv2.getRotationMatrix2D((kernal_size/2, kernal_size/2), 45, 1)
# kernal = np.hstack((kernal_matrix[:, :2], [[0], [0]]))
#         # kernal_matrix[:, :2] <- 회전 행렬에서 병진이동 벡터를 제외하고 회전 행렬 값만 가져옴
#         # [[0],[0]] <- 병진이동 벡터 (이동 X)
# kernal = cv2.warpAffine(kernal_direction, kernal, (kernal_size, kernal_size))

# motion_blur_img = cv2.filter2D(image, -1, kernal)
# plt.imshow(motion_blur_img)
# plt.show()
#### 모션 블러 ####


#### 난수 노이즈 ####
# gray_img = cv2.imread('image02.jpeg', cv2.IMREAD_GRAYSCALE)
# h, w = gray_img.shape

# mean = 0
# var = 100
# sigma = var ** 0.5

# gaussian = np.random.normal(mean, sigma, (h, w))
# noisy_image = gray_img + gaussian.astype(np.uint8)
# # uint8 -> 0 ~ 255
# cv2.imshow("", noisy_image)
# cv2.waitKey()
#### 난수 노이즈 ####

#### 채도 조정 ####
# img = cv2.imread('image02.jpeg')
# org_img = img.copy()

# img_hsv = cv2.cvtColor(img, cv2.COLOR_BGR2HSV)
# saturation_factor = 1.5
# img_hsv[:, :, 1] = img_hsv[:, :, 1] * saturation_factor

# saturated_img = cv2.cvtColor(img_hsv, cv2.COLOR_HSV2BGR)

# cv2.imshow("", org_img)
# cv2.waitKey()
# cv2.imshow("", saturated_img)
# cv2.waitKey()
#### 채도 조정 ####


#### 밝기 조정 ####
# img = cv2.imread('image02.jpeg')
# org_img = img.copy()

# bright_diff = 50
# img_brighten = cv2.convertScaleAbs(img, alpha=1, beta=bright_diff)

# cv2.imshow("org", org_img)
# cv2.imshow("brighten", img_brighten)
# cv2.waitKey()
#### 밝기 조정 ####

#### 노이즈 제거 ####
# img_filtered = cv2.medianBlur(image, 5)
# plt.imshow(image)
# plt.show()
# plt.imshow(img_filtered)
# plt.show()
#### 노이즈 제거 ####

#### 히스토그램 균일화 ####
# img_gray = cv2.imread("image02.jpeg", cv2.IMREAD_GRAYSCALE)
# img_equalized = cv2.equalizeHist(img_gray)

# cv2.imshow("org", img_gray)
# cv2.imshow("hist_equal", img_equalized)
# cv2.waitKey()
#### 히스토그램 균일화 ####

일반적으로 정사각형으로 만들면 화면비율이 깨짐

그런걸 방지하기 위해서 남는 부분은 다른 색으로 칠해버림

import matplotlib.pylab as plt
from PIL import Image

def expend2square(pil_img, background_color) :  # 배경이미지 크기계산
    width, heigth = pil_img.size
    
    if width == heigth :   # 이미 정사각형
        return pil_img
    
    elif width > heigth :  # 너비가 > 높이인 경우
        result = Image.new(pil_img.mode, (width, width), background_color)
        result.paste(pil_img, (0, (width - heigth) // 2))   # x 좌표는 0, y 좌표는 이미지 중앙에 이미지 붙임
        return result
    else :          # 높이가 > 너비인 경우
        result = Image.new(pil_img.mode, (heigth, heigth), background_color)
        result.paste(pil_img, ((heigth - width) //2,0))    # x 좌표는 이미지 중앙, y 좌표는 0 에 이미지 붙임
        return result
        

def resize_with_padding(pil_img, new_size, background_color) :  # 남는부분에 색칠하기
    img = expend2square(pil_img, background_color)
    img = img.resize((new_size[0], new_size[1]), Image.ANTIALIAS)
    
    return img


img = Image.open("./image01.jpeg")
img_new = resize_with_padding(img, (300,300), (0,0,255))  # 300, 300 : 사진 크기  # 0,0,255 : RGB 

plt.imshow(img)
plt.show()

plt.imshow(img_new)
plt.show()

XML Extensible Markup Language 어로, 데이터를 장하고 전하는 데 사용되는 마크업 언어입니다.


HTML과 매우 유사하 지만, XML은 데이터와 문서 구조를 설명하는 데 중점을 니다.

XML 스트 기반 형식이며, 데이터와 그 구조를 기하는 데 사용할 수 있는 여러가지 태그와 성을 제공합니다. 데이터는 요소(element)라고도 르는 태그를 사용하여 표시되며, 요소 는 (attribute) (value)을 가질 수 있습니다.

XML은 데이터를 계 구조로 구성할 수 있으, 다양한 소어 시스템 간에 데이터를 환하는 데 매우 유용합니다. , XML은 데이터의 검증  검색이 용이하며, 분의 로그래 어에서 XML 파 서를 지원하로 데이터를 게 처리할 수 있습니다.


import os 
import cv2
import matplotlib.pylab as plt
from xml.etree.ElementTree import parse

def xml_read(xml_path) :
    
    root = parse(xml_path).getroot()
    
    image_info = root.findall("image")
    
    for image in image_info :
        bbox = image.findall('box')
        # <image id="0" name="01.jpg" width="640" height="480">
        
        # image width height 
        image_width = image.attrib['width']
        image_heigth = image.attrib['height']
        
        # image name and path 
        image_name = image.attrib['name']
        image_name = os.path.join("./data/", image_name)
        
        # image read 
        image = cv2.imread(image_name)
        # image BGR -> RGB 
        image = cv2.cvtColor(image, cv2.COLOR_BGR2RGB)
        
        for box_info in bbox :
            label = box_info.attrib['label']
            
            # 값 -> string 타입 
            xtl = box_info.attrib['xtl']
            ytl = box_info.attrib['ytl']
            xbr = box_info.attrib['xbr']
            ybr = box_info.attrib['ybr']
            
            # 소수점이 포함이라 바로 int 값 변환 불가 하여 float 변환 
            xtl_f = float(xtl)
            ytl_f = float(ytl)
            xbr_f = float(xbr)
            ybr_f = float(ybr)
            
            # float -> int 변환 
            xtl_i = int(xtl_f)
            ytl_i = int(ytl_f)
            xbr_i = int(xbr_f)
            ybr_i = int(ybr_f)
            
            print(xtl_i, ytl_i, xbr_i, ybr_i, label)
            ### xtl="468.94" ytl="92.01" xbr="640.00" ybr="340.46"
            
            ### 이미지 시각화 
            image = cv2.rectangle(image, (xtl_i, ytl_i), (xbr_i, ybr_i), (0,255,0), 2)
            
            ### 라벨 추가 
            image = cv2.putText(image, label, (xtl_i, ytl_i-10), 
                  cv2.FONT_HERSHEY_SIMPLEX, 1, (0, 255, 255), 2, cv2.LINE_AA)
         
        plt.imshow(image)
        plt.show()
    
xml_read("./data/annotations.xml")
 

xml to yolo format 변경하기 


import os 
import cv2
import matplotlib.pylab as plt
from xml.etree.ElementTree import parse

label_number_dict = {'cat':0, 'dog':1}

def xml_read(xml_path) :
    
    root = parse(xml_path).getroot()
    
    image_info = root.findall("image")
    
    for image in image_info :
        bbox = image.findall('box')
        # <image id="0" name="01.jpg" width="640" height="480">
        
        # image width height 
        image_width = image.attrib['width']
        image_heigth = image.attrib['height']
        
        # image name and path 
        image_name = image.attrib['name']
        image_name_temp = image_name
        image_name = os.path.join("./data/", image_name)
        
        # image read 
        image = cv2.imread(image_name)
        # image BGR -> RGB 
        image = cv2.cvtColor(image, cv2.COLOR_BGR2RGB)
        
        for box_info in bbox :
            label = box_info.attrib['label']
            
            # 값 -> string 타입 
            xtl = box_info.attrib['xtl']
            ytl = box_info.attrib['ytl']
            xbr = box_info.attrib['xbr']
            ybr = box_info.attrib['ybr']
            
            # 소수점이 포함이라 바로 int 값 변환 불가 하여 float 변환 
            xtl_f = float(xtl)
            ytl_f = float(ytl)
            xbr_f = float(xbr)
            ybr_f = float(ybr)
            
            # float -> int 변환 
            x1_i = int(xtl_f)
            y1_i = int(ytl_f)
            x2_i = int(xbr_f)
            y2_i = int(ybr_f)
            
            ### xtl="468.94" ytl="92.01" xbr="640.00" ybr="340.46"
            
            # 이미지 사이즈가 필요 위에 있는 image_width, image_heigth 경우는 string 타입 형변환 필요 int 
            img_width_i = int(image_width)
            img_height_i = int(image_heigth)
            
            # Pascal_xyxy to YOlO center_x center_y yolo_w yolo_h 
            
            center_x = ((x2_i + x1_i)/(2*img_width_i))
            center_y = ((y2_i + y1_i)/(2*img_height_i))
            yolo_w = (x2_i - x1_i)/img_width_i
            yolo_h = (y2_i - y1_i)/img_height_i
                                    
            # file_name 
            image_name_temp = image_name_temp.replace('.jpg', '')
            
            # label cat, dog -> 0, 1 로 변경하기 
            label_number = label_number_dict[label]
            
            print("Pascal_xyxy to YOLO >> ", label_number,center_x, center_y, yolo_w, yolo_h)
    
            # 텍스트로 저장하기 
            with open(f"{image_name_temp}.txt", "a") as f:
                f.write(f"{label_number} {center_x} {center_y} {yolo_w} {yolo_h} \n")
    
xml_read("./data/annotations.xml")

Pascal_xyxy to YOLO >> 1 / 0.865625 / 0.45 / 0.26875 / 0.5166666666666667

Pascal_xyxy to YOLO >> 0 / 0.16171875 / 0.6041666666666666 / 0.3140625 / 0.44583333333333336

JSON(JavaScript Object Notation)은 경의 데이터 환 형식 입니다.


JSON은 사이 읽고 기에 용이하고, 기계가 분석하고 생성 하기도 쉬워 많이 사용됩니다.

특히 웹에서 데이터를 많이 사용되며, 분의 로그래어에서 JSON 형식을 다수 있습니다.

JSON은 키-값 쌍으로 이루어진 데이터 오브젝트를 장합니다. (key)는 문자이며, (value)은 문자, , 불리, , 객체 등이 수 있습니다. 이러한 데이터 오브젝트들은 중수 있어 복한 데이터도 표현할 수 있습니다.


import json

# json 파일을 가져와야합니다.
json_data_path ="./data/instances_default.json"

with open(json_data_path, 'r', encoding="utf-8") as j :  # 'r' read
    json_data = json.load(j)
    
print(f"json type : {type(json_data)}")
print("json_data : ", json_data )  # 키, 밸류로 반환

다차원 딕셔너리 형태라 원하는 정보를 위해선 한차원 더 들어가야합니다.

# 변수 선언
categories_info = json_data['categories']
# [{'id': 1, 'name': 'cat', 'supercategory': ''}, {'id': 2, 'name': 'dog', 'supercategory': ''}]

images_info = json_data['images']
# [{'id': 1, 'width': 640, 'height': 480, 'file_name': '01.jpg', 'license': 0, 'flickr_url': '', 'coco_url': '', 'date_captured': 0}]


위의 정보를 이용하여 이미지 시각화 실습


import json 
import os
import cv2
import matplotlib.pylab as plt

# json_path 경로 지정 
json_path = "./data/instances_default.json"

# json 읽기
with open(json_path, 'r', encoding='utf-8') as j : # 'r' : read
    json_data = json.load(j)
    
category_info = json_data['categories']
images_info = json_data['images']
annotations_info = json_data['annotations']

# 라벨 딕셔너리 선언 
label_dict = {1: "cat", 2:"dog"}  # 0 은 배경임

for image_json in images_info : 
    print(image_json)
    # {'id': 1, 'width': 640, 'height': 480, 'file_name': '01.jpg', 'license': 0, 'flickr_url': '', 'coco_url': '', 'date_captured': 0}

    file_name = image_json['file_name']
    image_path = os.path.join("./data/", file_name)
    image_id = image_json['id']
    print(image_path)
    # ./data/01.jpg
    
    # image read 
    image = cv2.imread(image_path)
    # iamge BGR -> RGB 
    image = cv2.cvtColor(image, cv2.COLOR_BGR2RGB)
    
    # bbox info 
    for anno_json in annotations_info : 
        if image_id == anno_json['image_id'] :
            bbox = anno_json['bbox']
            # 좌표 변수에 박스 좌표 저장 (int 형 변환 이유 : cv2.rectangle 좌표 값은 int 형태만 가능)
            x = int(bbox[0])
            y = int(bbox[1])
            w = int(bbox[2])
            h = int(bbox[3])
            # 박스 좌표 확인 
            print("bbox 좌표 >> " , x, y, w, h)
            # bbox 좌표 >>  468 92 171 248
            # bbox 좌표 >>  3 183 200 214 
            
            
            # 박스 그리기 
            cv2.rectangle(image, (x,y), (x+w, y+h), (0,255,0),2)
            
            # 라벨 표시 
            category_id = anno_json['category_id']
            label_name = label_dict[category_id]
            print(label_name)
            # dog
            # cat 
            
            image = cv2.putText(image, label_name, (x, y-10),  # 위에 글자두려고 -10 
                  cv2.FONT_HERSHEY_SIMPLEX, 1, (0, 255, 255), 2, cv2.LINE_AA)
            
            
    plt.imshow(image)
    plt.show()


json format -> Yolo format 으로 변경하고 텍스트 파일로 저장하기

import json 
import os
import cv2
import matplotlib.pylab as plt

# json_path 경로 지정 
json_path = "./data/instances_default.json"

# json 읽기
with open(json_path, 'r', encoding='utf-8') as j : 
    json_data = json.load(j)
    
category_info = json_data['categories']
images_info = json_data['images']
annotations_info = json_data['annotations']

# 라벨 딕셔너리 선언 
# 0 -> cat , 1 -> dog
label_dict = {1: 0, 2: 1}

for image_json in images_info : 
    print(image_json)
    file_name = image_json['file_name']
    image_path = os.path.join("./data/", file_name)
    image_id = image_json['id']
    print(image_path)
    print("file name ", file_name)
    
    # image read 
    image = cv2.imread(image_path)
    # iamge BGR -> RGB 
    image = cv2.cvtColor(image, cv2.COLOR_BGR2RGB)
    
    # image size 
    img_height, img_width, img_channel = image.shape
    
    # bbox info 
    for anno_json in annotations_info : 
        if image_id == anno_json['image_id'] :
            bbox = anno_json['bbox']
            # 좌표 변수에 박스 좌표 저장 (int 형 변환 이유 : cv2.rectangle 좌표 값은 int 형태만 가능)
            x = int(bbox[0])
            y = int(bbox[1])
            w = int(bbox[2])
            h = int(bbox[3])
            
            # 박스 그리기 
            cv2.rectangle(image, (x,y), (x+w, y+h), (0,255,0),2)
            
            # 라벨 표시 
            category_id = anno_json['category_id']
            label_number = label_dict[category_id]
            
            # xywh -> center_x, center_y, w, h 변경 하기 
            center_x = ((2*x + w)/(2*img_width))
            center_y = ((2*y + h)/(2*img_height))
            yolo_w = w/img_width
            yolo_h = h/img_height
            
            print("yolo 좌표 변경 값 >> ",label_number,center_x, center_y, yolo_w, yolo_h)
            # 이미지 명과 라벨 파일 명이 동일해야합니다. 
            # 위에 file_name 경우는 01.jpg 우리가 필요한것은 01 이라는 이름 입니다. 
            #file_name_tmep = os.path.splitext(file_name)[0]
            file_name_temp = file_name.replace(".jpg", "")
            
            # 텍스트 파일 쓰기 
        with open(f"{file_name_temp}.txt", "a") as f:  # "a" 는 덮어쓰기 말고 새로만듬
            f.write(f"{label_number} {center_x} {center_y} {yolo_w} {yolo_h} \n")

학습을  위해 대량의 사진을 가져오기 위한 코드


일반적으로 사진을 그냥 막 가져와버리면 정렬이 제대로 안됨


우선 사과라는 폴더안에 있는 사진들을 가져오고 싶을때

# os listdir
import os
# 이미지가 저장된 디렉토리 경로
img_dir = './사과/'

# 디렉토리 내 모든 파일 목록 가져오기
file_list = os.listdir(img_dir)
print(file_list)

# 단점 정렬 되지 않습니다.


sorted를 써도 마찬가지

# 만약 정렬 하고 싶다면 sort 함수 사용 
# os listdir
import os
# 이미지가 저장된 디렉토리 경로
img_dir = './사과/'

# 디렉토리 내 모든 파일 목록 가져오기
file_list = sorted(os.listdir(img_dir))
print(file_list)


import glob
import os 

file_list = glob.glob(os.path.join("./사과/", "*.jpg"))
print(file_list)

# 을 활용해야 제대로 정렬된 상태로 가져옴


폴더안의 폴더도 for문으로 가능함

#### os.walk 를 이용한 폴더에서 이미지 파일 가져오기 함수 구현

os.walk() 하위의 폴더들을 for문으로 탐색할 수 있게 해줍니다. 인자로 전달된 path에 대해서 다음 3개의 값이 있는 tuple을 넘겨줍니다.

- root : dir과 files가 있는 path
- dirs : root 아래에 있는 폴더들
- files : root 아래에 있는 파일들


def get_img_paths(root_path): # 하위에 있는 경로 모두 탐색
    file_paths = []
    for (path, dir, files) in os.walk(root_path):
        for file in files:
            ext = os.path.splitext(file)[-1].lower()
            formats = ['.bmp', '.jpg', '.jpeg', '.png', '.tif', '.tiff', '.dng']
            if ext in formats:
                file_path = os.path.join(path, file)
                file_paths.append(file_path)
    return file_paths

file_paths = get_img_paths("./사과/")
print(file_paths)

# 정렬 하고 싶다면 natsort.natsorted 이용
# file_paths_sort = natsort.natsorted(file_paths)
# print(file_list_sort)


1. 순서가 없는 범주형 데이터

import numpy as np 
from sklearn.preprocessing import LabelBinarizer, MultiLabelBinarizer

feature = np.array((['가나다라'],
                    ['가나다라'],
                    ['아바하자'],
                    ['카나다사']))

print(feature)

# 원-핫 인코더 생성
one_hot = LabelBinarizer()
one_hot.fit_transform(feature) # 특성을 원-핫 인코딩 변환 
# 특성 클래스 확인 
print(one_hot.classes_)

"""
[['가나다라']
 ['가나다라']
 ['아바하자']
 ['카나다사']]
['가나다라' '아바하자' '카나다사']
"""


2.  다중 클래스 특성에 대한 처리

multiclass_feature = [('가나다라마','아자바하나'),
                     ('자다가나라','자다나타하'),
                     ('가나다라마','아자바하나'),
                     ('아마자나가','아카나다하'),
                     ('가나다라마','아자바하나'),
                     ]
one_hot_mult = MultiLabelBinarizer()
one_hot_mult.fit_transform(multiclass_feature)
print(one_hot_mult.classes_)

# ['가나다라마' '아마자나가' '아자바하나' '아카나다하' '자다가나라' '자다나타하']


3. 문자 타깃 데이터 원-핫 인코딩

from sklearn.preprocessing import OneHotEncoder

str_feature = ([['안녕', 1],
                ['저녁', 2],
                ['안녕', 1],
                ['점심', 3],
               ])

one_hot_encoder = OneHotEncoder(sparse=False)

# One hot encoder -> 입력 특성 배열을 모두 범주형
one_hot_encoder.fit_transform(str_feature)
print(one_hot_encoder.categories_)

# [array(['안녕', '저녁', '점심'], dtype=object), array([1, 2, 3], dtype=object)]

4. 순서가 있는 범주형 특성 인코딩

- 순서가 있는 클래스는 순서 개념을 가진 수치값으로 변환 
- 딕셔너리 사용해서 -> 특성 

import pandas as pd 
# 특성 데이터 생성
dataframe = pd.DataFrame({
    'Score' : ["Low", "Low", "Medium", "Medium", "High"]
})

print(dataframe)

"""
    Score
0     Low
1     Low
2  Medium
3  Medium
4    High
"""


# 매핑 딕셔너리 생성
scale_mapper = {
    "Low" : 1,
    "Medium" : 2,
    "High" : 3
}

print(scale_mapper)
# {'Low': 1, 'Medium': 2, 'High': 3}

data = dataframe["Score"].replace(scale_mapper)
print(data)
"""
0    1
1    1
2    2
3    2
4    3
Name: Score, dtype: int64
"""

4-2. 순서가 있는 범주형 특성 인코딩

from sklearn.preprocessing import OrdinalEncoder

feature_array = np.array((['Low', 10],
                    ['High', 40],
                    ['Medium',3],))

ordinal_encoder = OrdinalEncoder() 
ordinal_encoder.fit_transform(feature_array)
print(ordinal_encoder.categories_)
# [array(['High', 'Low', 'Medium'], dtype='<U21'), array(['10', '3', '40'], dtype='<U21')]

4-3. 순서가 있는 범주형 특성 인코딩

- 특성 딕셔너리 인코딩

from sklearn.feature_extraction import DictVectorizer
# 딕셔너리 생성 
data_dict =[{"Red" : 2 , "Blue" : 4},
            {"Red" : 4 , "Blue" : 3},
            {"Red" : 1 , "Yellow" : 2 },
            {"Red" : 1 , "Yellow" : 2}]


dictVectorizer = DictVectorizer(sparse=False)

feature_dict = dictVectorizer.fit_transform(data_dict)
print(feature_dict)

feature_dict_name = dictVectorizer.get_feature_names()
print(feature_dict_name)

dict_data = pd.DataFrame(feature_dict,  columns=feature_dict_name)
print(dict_data)


"""
[[4. 2. 0.]
 [3. 4. 0.]
 [0. 1. 2.]
 [0. 1. 2.]]
['Blue', 'Red', 'Yellow']
   Blue  Red  Yellow
0   4.0  2.0     0.0
1   3.0  4.0     0.0
2   0.0  1.0     2.0
3   0.0  1.0     2.0
"""


범주형 데이터 - 누락된 클래스값 대처하기 1

- knn으로 주변 그룹을 활용하여 nan의 값 예측함

from sklearn.neighbors import KNeighborsClassifier
x = np.array([[0, 2.10, 1.48],
             [1,1.18,1.33],
             [0,1.22,1.27],
             [1, -0.20, -1.15]])

x_with_nan = np.array([[np.nan, 0.87, 1.33], [np.nan, -0.67, -0.22]]) # 일부러 nan 생성

clf = KNeighborsClassifier(3, weights='distance')

print(x[:,1:])
print(x[:,0])

"""
[[  nan  0.87  1.33]
 [  nan -0.67 -0.22]]
[[ 2.1   1.48]
 [ 1.18  1.33]
 [ 1.22  1.27]
 [-0.2  -1.15]]
[0. 1. 0. 1.]
"""
train_model = clf.fit(x[:,1:], x[:,0])
imputer_values = train_model.predict(x_with_nan[:,1:]) # 누락된 값의 클래스 예측 

x_with_imputer = np.hstack((imputer_values.reshape(-1,1), x_with_nan[:,1:]))
data = np.vstack((x_with_imputer, x)) # 두 특성 행렬을 연결 
print(data)
"""
[[ 0.    0.87  1.33]
 [ 1.   -0.67 -0.22]
 [ 0.    2.1   1.48]
 [ 1.    1.18  1.33]
 [ 0.    1.22  1.27]
 [ 1.   -0.2  -1.15]]
 """


근처의 값을 비교해서 주변 그룹에 많이 있는 라벨을 따라감 


범주형 데이터 - 누락된 클래스값 대처하기 2

- 누락된 값을 특성에서 가장 자주 등장하는 값으로 채우기

from sklearn.impute import SimpleImputer
x_complete = np.vstack((x_with_nan, x))
print("전")
print(x_complete)

impute = SimpleImputer(strategy='most_frequent')
data_impute = impute.fit_transform(x_complete)
print("후")
print(data_impute)
"""
전
[[  nan  0.87  1.33]
 [  nan -0.67 -0.22]
 [ 0.    2.1   1.48]
 [ 1.    1.18  1.33]
 [ 0.    1.22  1.27]
 [ 1.   -0.2  -1.15]]
후
[[ 0.    0.87  1.33]
 [ 0.   -0.67 -0.22]
 [ 0.    2.1   1.48]
 [ 1.    1.18  1.33]
 [ 0.    1.22  1.27]
 [ 1.   -0.2  -1.15]]
 """

PCA 클래스: Scikit-learn의 decomposition 모듈에서 제공되는 클래스 중 하나입니다. PCA는 데이터셋의 차원을 감소시키는 기술로, 데이터셋에서 가장 중요한 특성만 추출하여 새로운 차원 축으로 변환합니다. 이를 통해 데이터셋의 노이즈(noise)를 제거하고, 더욱 빠르고 효율적인 학습이 가능해집니다.

n_components: PCA 클래스의 인자 중 하나로, 추출할 주성분(principal component)의 수를 지정합니다. 여기서는 99%의 분산(variance)을 유지하도록 설정되어 있습니다. 이는 데이터셋에서 99%의 정보가 유지되도록 차원을 축소하는 것을 의미합니다.

whiten: PCA 클래스의 인자 중 하나로, True로 설정할 경우 PCA의 결과로 나오는 주성분들이 서로 독립적인 값이 되도록 백색화(whitening)를 수행합니다. 백색화를 하면 각 주성분의 분산이 1이 되고, 상관 관계가 없는 성분들로 구성된 새로운 특성 공간이 만들어집니다.

fit_transform(): PCA 클래스에는 fit()과 transform() 메서드가 있습니다. fit() 메서드는 PCA 모델을 학습하고, transform() 메서드는 학습된 모델을 사용하여 데이터를 변환합니다. fit_transform() 메서드는 이 두 단계를 한 번에 수행합니다.

위의 같이 PCA이용하면 99%의 분산을 유지하도록 새로운 특성(feature) 공간으로 변환하고 있습니다. 결과적으로, 원본 데이터셋의 특성 개수는 features.shape[1]으로 확인할 수 있고, PCA를 수행하여 감소된 특성 개수는 features_pca.shape[1]으로 확인할 수 있습니다. 이렇게 차원 축소를 수행하면, 모델의 학습 시간을 단축시키고, 과적합(overfitting)을 방지할 수 있습니다.


from sklearn.preprocessing import StandardScaler
from sklearn.decomposition import PCA
from sklearn import datasets

digits = datasets.load_digits() # 8x8 크기의 손글씨 숫자 데이터 로드 
feature = StandardScaler().fit_transform(digits.data) # 특성 행렬을 표준화 처리 

print(feature)
 [[ 0.         -0.33501649 -0.04308102 ... -1.14664746 -0.5056698
  -0.19600752]
 [ 0.         -0.33501649 -1.09493684 ...  0.54856067 -0.5056698
  -0.19600752]
 [ 0.         -0.33501649 -1.09493684 ...  1.56568555  1.6951369
  -0.19600752]
 ...
 [ 0.         -0.33501649 -0.88456568 ... -0.12952258 -0.5056698
  -0.19600752]
 [ 0.         -0.33501649 -0.67419451 ...  0.8876023  -0.5056698
  -0.19600752]
 [ 0.         -0.33501649  1.00877481 ...  0.8876023  -0.26113572
  -0.19600752]]

pca = PCA(n_components=0.99, whiten=True)  # 99% 분산을 유지하도록 PCA객체 생성 / whiten=True 평균을 0, 표준편차를 1로변경
features_pca = pca.fit_transform(feature) # PCA 수행

print("원본 특성 개수 >> " , feature.shape[1])
print("줄어든 특성 개수 >> " , features_pca.shape[1])

# 원본 특성 개수 >>  64
# 줄어든 특성 개수 >>  54

1. StandardScaler() 
 >> Scikit-learn의 전처리(preprocessing) 모듈에서 제공되는 클래스 중 하나입니다. 이 클래스는 데이터를 평균이 0, 분산이 1인 가우시안 정규 분포(standard normal distribution)로 변환합니다.

2. digits.data : digits 데이터셋에서 숫자 이미지의 각 픽셀 값을 포함하는 배열 

3. fit_transform() 메서드 
 >> StandardScaler 클래스에는 데이터를 변환하는 두 가지 단계가 있습니다. 첫째, 모델을 학습(fit)하고, 둘째, 학습된 모델을 사용하여 데이터를 변환(transform)합니다. fit_transform() 메서드는 이 두 단계를 한 번에 수행합니다. 즉, 데이터를 표준화(normalize)하고, 변환된 값을 반환합니다.
 
따라서 위의 코드는 digits 데이터셋의 특성을 가우시안 정규 분포로 변환한 후, 변환된 값을 featuress 변수에 할당 이렇게 정규화를 수행하면, 모델이 데이터를 더 잘 이해하고, 모델의 예측 성능을 향상 시킬 수 있습니다.


결과값 비교


1. 데이터불러오기

from sklearn.datasets import load_digits
from sklearn.model_selection import train_test_split
from sklearn.linear_model import LogisticRegression
from sklearn.metrics import accuracy_score

digits = load_digits()

# 진짜 차이가 있는지 체크 하기 위해서 -> 정규화 하지 않은 데이터로 분류 모델 훈련
print(len(digits.data))   
print(len(digits.target))
x_train, x_test, y_train, y_test = train_test_split(digits.data, digits.target , random_state=777)

print(len(x_train), len(x_test))
print(len(y_train), len(y_test))


"""
8 : 2 
2 -> 1 : 1 
8 : 1 : 1


1. 폴더 생성 (이미지 100개)
2. 폴더 읽고 -> train val test 나눠서 폴더 생성해서 거기에 이미지 저장
"""

# 1797
# 1797
# 1347 450
# 1347 450​


2. 모델불러오기

model = LogisticRegression(max_iter=10000)
model.fit(x_train, y_train)
y_pred = model.predict(x_test)

no_standardScaler_acc_score = accuracy_score(y_test, y_pred) # 정답지 예측치
print(no_standardScaler_acc_score)

# 0.9533333333333334


3. StandardScaler 적용후 -> ACC

from sklearn.preprocessing import StandardScaler

scaler = StandardScaler()
x_train_norm = scaler.fit_transform(x_train)
x_test_norm = scaler.transform(x_test)
model_norm = LogisticRegression(max_iter=10000)
model_norm.fit(x_train_norm, y_train)
y_pred_norm = model_norm.predict(x_test_norm)

standardScale_acc_score = accuracy_score(y_test, y_pred_norm)
print(standardScale_acc_score)

# 0.9555555555555556 값 상승함

딥러닝은 가장 적합한 가중치를 찾는과정

사용용도에따라 다양한 모델이 있다 (CNN, DNN, RNN)

RNN은 주로 시계열 데이터에 사용된다. (시간의 흐름에 따라 이전 결과에 영향을 계속 받음)

CNN은 주로 이미지를 분석할때 사용 (차원감소) 


신경망의 종류

시계열데이터에 주로 사용

⦿ 시계열 데이터에 주로 사용됨. 앞의 결과가 뒤의 결과에 영향을 줌


⦿ 이미지 분석할때 항상 나옴


신경망 기초

함수로 표현하기

# 신경망 기초

import math
import numpy as np
import matplotlib.pyplot as plt

# 일차함수

def linear_function(x):
  a=0.5
  b=2

  return a*x+b
  
x = np.arange(-5,5,0.1)
y = linear_function(x)

plt.plot(x,y)
plt.xlabel('x')
plt.ylabel('y')
plt.title('Linear Function')


# 2차 함수
def quadratic_fuction(x):
  a = 1
  b = -1
  c = -2

  return a*x**2 + b*x + c
  
  
x = np.arange(-5,5,0.1)
y = quadratic_fuction(x)

plt.plot(x,y)
plt.xlabel('x')
plt.ylabel('y')
plt.title('Quadratic Function')


# 3차 함수

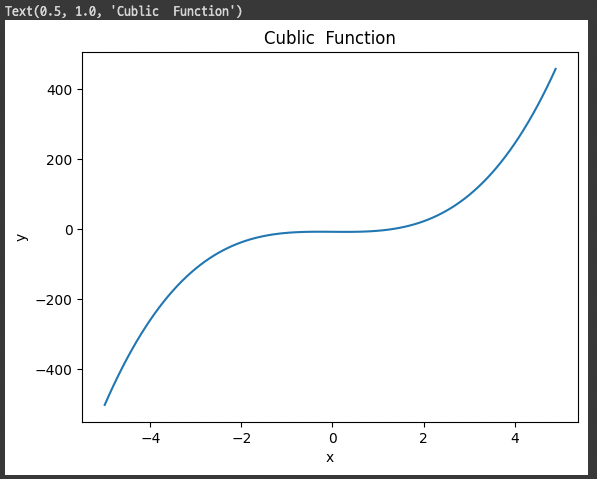
def cubic_function(x):
  a = 4
  b = 0
  c = -1
  d = -8

  return a*x**3 + b*x**2 + c*x + d
  
x = np.arange(-5,5,0.1)
y = cubic_function(x)

plt.plot(x,y)
plt.xlabel('x')
plt.ylabel('y')
plt.title('Cublic  Function')


텐서의 표현


Numpy ndarray를 통한 연산

# Tensor의 표현  (스칼라와 벡터)

# Tensor의 표현   # 스칼라와 벡터 

x = np.array(3)  #스칼라
print(x)   
print(x.shape)  # 형태, 모양
print(x.ndim)   # 차원

# 3
# ()
# 0

y = np.array([3])  # 벡터
print(y)
print(y.shape)
print(y.ndim)

# [3]
# (1,)
# 1


# 1차원 텐서

a = np.array([1,2,3,4])
b = np.array([5,6,7,8])
c = a + b
d = d + x    # x = 3     d(1차원과) + x(0차원) 합도 가능
print(c)
print(c.shape)
print(c.ndim)

# [ 6  8 10 12]
# (4,)
# 1

print(d)
print(d.shape)
print(d.ndim)

# [4 5 6 7]
# (4,)
# 1

# 차원이 달라서 부족한 값들은 그냥 같은값을 복사해서 연산한다. 브로드캐스팅이라 한다.

# 똑같이 하나의 성분이라도 리스트에 포함시키면 1차원이 되므로 벡터가 된다.


# 벡터의 곱

# 벡터의 곱

x = np.array([1,2,0])
y = np.array([0,2,1])
z = np.dot(x, y)

print(z)
print(z.shape)
print(np.ndim(z))

# 4
# ()
# 0


# 전치 행렬

# 전치 행렬
a = np.array([[1,2,3],[4,5,6]])
print(a)
print(a.shape)

# [[1 2 3]
   [4 5 6]]
# (2, 3)


a_ = a.T    # 전치행렬로 행과 열을 바꿈
print(a_)
print(a_.shape)

# [[1 4]
   [2 5]
   [3 6]]
# (3, 2)


# 2차원 텐서

# 2차원 텐서 

matrix = np.array([[1,2,3],[4,5,6]])

print(matrix)
print(matrix.shape)
print(np.ndim(matrix))

# [[1 2 3]
  [4 5 6]]
# (2, 3)
# 2


a = np.array([[1,2],[3,4]])
b = np.array([[10,10],[10,10]])

print(a * b)
# [[10 20]     
   [30 40]]


# 3차원 텐서

# 3차원 텐서

x = np.array([[[5,3,2,1],
               [5,5,3,1],
               [6,1,2,3]],
              [[1,1,1,1],
               [3,4,7,5],
               [1,8,3,4]],
              [[10,9,3,9],
               [5,4,3,2],
               [7,6,3,4]]])
print(x)
print(x.shape)
print(np.ndim(x))

#[[[ 5  3  2  1]
   [ 5  5  3  1]
   [ 6  1  2  3]]

 [[ 1  1  1  1]
  [ 3  4  7  5]
  [ 1  8  3  4]]

 [[10  9  3  9]
  [ 5  4  3  2]
  [ 7  6  3  4]]]
# (3, 3, 4)
# 3


@ 이미지는 가로축, 세로축, 색상값 의 3차원 데이터이다.

@ [w, h, [r,g,b]] 의 형태이다.

@ 시계열 데이터도 3차원텐서를 사용한다. 시계열데이터란 한쪽축이 시간축으로 시간에따른 데이터들의 변화를 나타내는 것을 의미한다. 주식, 기상 등의 값이있다.

@ 영상은 4차원텐서 w, h, f(프레임), [r,g,b] 의 형태


[4차원, 5차원 텐서]


신경망의 구조

퍼셉트론


논리회로


# 논리게이트

# AND 게이트

# 논리 게이트

# AND
def AND(a,b):
  input = np.array([a,b])
  weights = np.array([0.4, 0.4])	# 가중치 +
  bias = -0.6				# 편향 강한 -
  value = np.sum(input * weights) + bias

  if value <= 0:
    return 0
  else:
    return 1
    
    
print(AND(0,0))
print(AND(0,1))
print(AND(1,0))
print(AND(1,1))

# 0
# 0
# 0
# 1

가중치와 바이어스를 컴퓨터가 스스로 찾도록 하는것이 딥러닝


x1 = np.arange(-2,2,0.01)
x2 = np.arange(-2,2,0.01)
bias = -0.6

y = (-0.4 * x1 - bias) / 0.4

plt.axvline(x=0)
plt.axhline(y=0)

plt.plot(x1, y, 'r--')
plt.scatter(0,0,color='orange', marker='o',s=150)
plt.scatter(0,1,color='orange', marker='o',s=150)
plt.scatter(1,0,color='orange', marker='o',s=150)
plt.scatter(1,1,color='black', marker='^',s=150)

plt.xlim(-0.5,1.5)
plt.ylim(-0.5,1.5)
plt.grid()

(1, 1)만 True가 됨


# OR 게이트

# OR 
def OR(a,b):
  input = np.array([a,b])
  weights = np.array([0.4, 0.4])	# 가중치 +
  bias = -0.3				# 편향 약한 -
  value = np.sum(input * weights) + bias

  if value <= 0:
    return 0
  else:
    return 1
    
print(OR(0,0))
print(OR(0,1))
print(OR(1,0))
print(OR(1,1))

# 0
# 1
# 1
# 1


# NAND 게이트

# NAND
def NAND(a,b):
  input = np.array([a,b])
  weights = np.array([-0.5, -0.5])      # 가중치 -
  bias = 0.7				# 편향은 강한 +
  value = np.sum(input * weights) + bias

  if value <= 0:
    return 0
  else:
    return 1
    
print(NAND(0,0))
print(NAND(0,1))
print(NAND(1,0))
print(NAND(1,1))

# 1
# 1
# 1
# 0
x1 = np.arange(-2, 2, 0.01)
x2 = np.arange(-2, 2, 0.01)
bias = 0.7

y = (0.6 * x1 - bias) / -0.5

plt.axvline(x=0)
plt.axhline(y=0)

plt.plot(x1, y, 'r--')
plt.scatter(0,0,color='black',marker='o',s=150)
plt.scatter(0,1,color='black',marker='o',s=150)
plt.scatter(1,0,color='black',marker='o',s=150)
plt.scatter(1,1,color='orange',marker='^',s=150)
plt.xlim(-0.5,1.5)
plt.ylim(-0.5,1.5)
plt.grid()
plt.show()

(1,1)만 False가 됨


# XOR 게이트

def XOR(x1, x2):
  s1 = NAND(x1, x2)
  s2 = OR(x1, x2)
  y = AND(s1, s2)

  return y
  
print(XOR(0,0))
print(XOR(0,1))
print(XOR(1,0))
print(XOR(1,1))

# 0
# 1
# 1
# 0


샘알트만 온다는데 안간다고?


https://openai.com/form/openai-tour-2023


OpenAI Tour 2023

OpenAI wants to hear from our users and developers. Please sign up if you’d like to meet with us!

openai.com


https://aws.amazon.com/ko/events/summits/seoul/


AWS Summit Seoul

국내 최대 규모의 IT 컨퍼런스, AWS Summit Seoul 이 드디어 다시 현장에서 여러분들을 만납니다. 최신 클라우드 기술부터 궁금했던 기술 데모까지 모두 만날 수 있는 곳, AWS Summit Seoul로 여러분을 초

aws.amazon.com


'AI' 카테고리의 다른 글

[ChatGPT] VScode에서 ChatGPT 바로 사용하기  (0) 2023.02.17

https://www.coursera.org/specializations/machine-learning-introduction

추천강의 


1) 지도학습

1. 회귀  : 숫자 예측

  • 선형 and 비선형
  • Gradient Descent(경사하강법)
  • Bias and variance trade-off (편향-분산)

2. 분류 : 분류 예측

  • 로지스틱 회귀 and 소프트맥스 회귀
  • SVM
  • DT
  • Linear Discriminant Analysis (LDA 선형판별분석)

3. 앙상블 학습

  • Bagging
  • Boosting

1-2) 비지도 학습


1. 차원축소(전처리)

  • PCA
  • SVD

2. 군집화 (분류/클러스터링)

  • K-means
  • Mean shift
  • Gaussian Mixture Model
  • DBSCAN

'AI > [ML]' 카테고리의 다른 글

[ML] 2. Cross Validation 교차 검증  (0) 2023.02.09
[ML] Scikit-learn 을 활용한 붓꽃 품종 예측하기  (0) 2023.02.08

개발자들에게 검색은 생명과도 같은데 그 검색을 ChatGPT가 패러다임을 바꿔버렸다.

요즘 구글 검색 전에 chatGPT에게 먼저 물어보는데 나름 답변이 마음에 든다.

그러다 이번에 VScode extension이 생겼다길래 한번 알아보기로 했다.


1. VScode 왼쪽 상단바 > 확장 > "ChatGPT" 검색


검색을 해도 안뜬다면 VScode 버전을 확인해주세요!

https://marketplace.visualstudio.com/items?itemName=gencay.vscode-chatgpt


2.  API 받기

설치가 되고 처음 여기를 들어오면 api를 달라고 한다.

 api 받기 버튼을 누르면 https://openai.com/api/  로 이동하고 로그인 후 api를 받을 수 있다.  


3. 활용해보기

파이썬 코드 print()를 자바 코드로 바꿔달라고 했는데

바로 튀어나온다!!

VScode에서 ChatGPT로 바로 코드변환이라니...

'AI' 카테고리의 다른 글

[AI] AI 컨퍼런스 링크모음  (0) 2023.04.06


Seaborn은 Matplotlib의 기능과 스타일을 확장한 파이썬 시각화 도구의 고급버전이지만 쉽다.

# import library
import seaborn as sns

# 타이타닉 데이터셋 로딩
titan_df = sns.load_dataset('titanic')


회귀직선이 있는 산점도

import matplotlib.pyplot as plt
import seaborn as sns

# 스타일을 지정 - darkgrid
sns.set_style('darkgrid')
# 그래프 객체 생성 - 한 out에 그래프를 살펴보도록
fig = plt.figure(figsize=(15,5)) # 15: 가로길이 // 5: 세로길이
ax1 = fig.add_subplot(1,2,1)  # 1 x 2 사이즈에서 1번째 (왼쪽에 위치함)
ax2 = fig.add_subplot(1,2,2)  # 1 x 2 사이즈에서 2번째 (오른쪽에 위치함)

# 그래프 그리기 - 선형회귀선 표시 (fit_reg = True)
sns.regplot(x='age', y='fare',
           data=titan_df,
           ax=ax1)


# 그래프 그리기 - 선형회귀선 미표시 (fit_reg = false)
sns.regplot(x='age', y='fare',
           data=titan_df,
           ax=ax2,
           fit_reg=False)

plt.show()


히스토그램 및 밀도함수


# 그래프 객체 생성 - 한 out에 그래프를 살펴보도록
fig = plt.figure(figsize=(15,5)) # 15,5 // 16,8
ax1 = fig.add_subplot(1,3,1)
ax2 = fig.add_subplot(1,3,2)
ax3 = fig.add_subplot(1,3,3)

# 기본값 
sns.distplot(titan_df.fare, ax=ax1)

# hist = False
sns.distplot(titan_df.fare, hist=False, ax=ax2)

# kde = False
sns.distplot(titan_df.fare, kde=False, ax=ax3) # Kernel Density 

# 차트 제목 표시
ax1.set_title('titan fare-hist/kde')
ax2.set_title('titan fare-hist')
ax3.set_title('titan fare-kde')

plt.show()


히트맵(Heat-map)

# 테이블 생성
table = titan_df.pivot_table(index=['sex'], columns=['class'], aggfunc='size')

# 히트맵 그리기
sns.heatmap(table,
           annot=True,
           fmt='d',
           linewidth=1) # heat-map을 쓰실때 cmap - color mapping :: heatmap_cmap의 종류

박스플롯 / 바이올린 플롯

import matplotlib.pyplot as plt
import seaborn as sns

# 데이터 로드
titan_df = sns.load_dataset('titanic')

# set_style theme
sns.set_style('whitegrid')

# 그래프 객체 생성
fig = plt.figure(figsize=(15,5))
ax1 = fig.add_subplot(2,2,1)
ax2 = fig.add_subplot(2,2,2)
ax3 = fig.add_subplot(2,2,3)
ax4 = fig.add_subplot(2,2,4)

# 박스플롯 - 기본값
sns.boxplot(x='alive', y='age', data=titan_df, ax=ax1).set(title='BOXPLOT')
      # .set(title='BOXPLOT') 타이틀 넣어주기 or 객체.set_title("타이틀")

# 박스플롯 - hue 변수 추가 
sns.boxplot(x='alive', y='age', hue='sex', data=titan_df, ax=ax2).set(title='BOXPLOT + HUE')

# 바이올린 플롯 - 기본값
sns.violinplot(x='alive', y='age', data=titan_df, ax=ax3).set(title='VIOLINPLOT')

# 바이올린 플롯 - hue 변수 추가 
sns.violinplot(x='alive', y='age', hue='sex', data=titan_df, ax=ax4).set(title='VIOLINPLOT+HUE')


막대 그래프

# 그래프 객체 생성
fig = plt.figure(figsize=(15,5))
ax1 = fig.add_subplot(1,3,1)
ax2 = fig.add_subplot(1,3,2)
ax3 = fig.add_subplot(1,3,3)

# x축, y축에 변수 할당
sns.barplot(x='sex', y='survived', data=titan_df, ax=ax1)

# x축, y축에 변수 할당 후, hue 옵션 추가
sns.barplot(x='sex', y='survived', hue='class', data=titan_df, ax=ax2)

# x축, y축에 변수 할당 후, hue 옵션 추가 후 누적 출력
sns.barplot(x='sex', y='survived', hue='class', dodge=False, data=titan_df, ax=ax3)

# 차트 제목 표시
ax1.set_title('titan survived - sex')
ax2.set_title('titan survived - sex/class')
ax3.set_title('titan survived - sex/class(stacked)')

plt.show()


범주형 데이터의 산점도

import matplotlib.pyplot as plt
import seaborn as sns

# titan
titan_df = sns.load_dataset('titanic')

# set style theme
sns.set_style('whitegrid')

# 그래프 객체 생성
fig = plt.figure(figsize=(15,5))
ax1 = fig.add_subplot(1,2,1)
ax2 = fig.add_subplot(1,2,2)

# 이산형 변수의 분포 - 데이터 분산 고려를 안한다면(중복 표시 O)
sns.stripplot(x='class',
             y='age',
             data=titan_df,
             ax=ax1)

# 이산형 변수의 분포 - 데이터 분산 고려를 한다면(중복 표시 X)
sns.swarmplot(x='class',
             y='age',
             data=titan_df,
             ax=ax2)

# 차트 제목 표시
# ax1.set_title('Strip Plot')
# ax2.set_title('Swarm Plot')

plt.show()

'AI > [Visualization]' 카테고리의 다른 글

[Matplotlib] Pie그래프  (0) 2023.02.13
[Matplotlib] 막대바  (0) 2023.02.13
[Matplotlib] 산점도 찍기  (0) 2023.02.13
[Matplotlib] 시각화 첫 단계  (0) 2023.02.07
# 한국어 폰트 적용

import matplotlib
# matplotlib.rcParams['font.family'] = 'Malgun Gothic' # 윈도우즈의 '맑은 고딕'설정
matplotlib.rcParams['font.family'] = 'AppleGothic'    # 맥북 '애플 고딕'설정

matplotlib.rcParams['axes.unicode_minus'] = False


# 도형 1
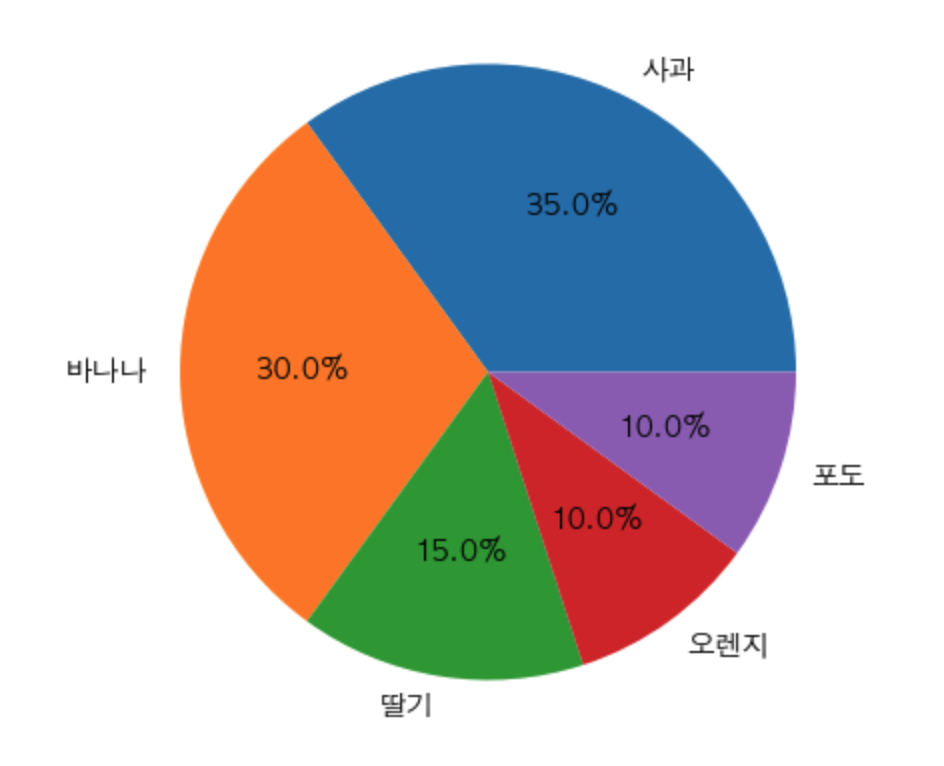
fruit = ['사과','바나나','딸기','오렌지','포도']
result = [7,6,3,2,2]
import matplotlib.pyplot as plt
plt.pie(result)
plt.show()

# 도형 2
# 생성한 원이 타원 -> 원형으로 변환
plt.figure(figsize=(5,5))
plt.pie(result, labels = fruit, autopct = '%.1f%%')
plt.show()

도형 1
도형 2


# 시계방향순 데이터 정렬

plt.figure(figsize=(5,5))
plt.pie(result, labels = fruit, autopct = '%.1f%%', startangle=90, counterclock=False )  

# startangle=90 x축 기준 90도 에서 시작 (생략시 0도)
# autopct 소수점 보여줄꺼
# counterclock=False  시계방향

plt.show()


explode_value = (0.1, 0,0,0,0)   # 1번째 요소 0.1 만큼 파이에서 나오게

# 시계방향 순으로 데이터 pie_chart를 생성
plt.figure(figsize=(5,5))
plt.pie(result, labels = fruit, autopct = '%.1f%%', startangle =90, counterclock=False, explode=explode_value, shadow=True)

# img 저장하기
plt.savefig('./save_test0.png')
plt.show()


# 사진의 해상도 높이기 dpi(dot per inch)
import matplotlib as mpl
mpl.rcParams['figure.figsize']

# 해상도 보기 dpi를 찍어보기 
mpl.rcParams['figure.dpi']


import numpy as np
import matplotlib.pyplot as plt

x = np.arange(0, 5)
x
y1 = x
y2 = x+1
y3 = x+2
y4 = x+3


<y= x 꼴 그래프 만들어보기>

plt.plot(x,y1, x,y2, x,y3, x,y4)

plt.grid()
plt.xlabel('X')
plt.ylabel('Y')
plt.title('Saving a figure')

# 위의 이미지 저장 
plt.savefig('./save_test10', dpi=1000)

'AI > [Visualization]' 카테고리의 다른 글

[Seaborn] Seaborn 그래프 형태  (0) 2023.02.13
[Matplotlib] 막대바  (0) 2023.02.13
[Matplotlib] 산점도 찍기  (0) 2023.02.13
[Matplotlib] 시각화 첫 단계  (0) 2023.02.07


<2가지 비교사항을 막대바로 정렬해보기>

# 한국어 폰트 적용

import matplotlib
# matplotlib.rcParams['font.family'] = 'Malgun Gothic' # 윈도우즈의 '맑은 고딕'설정
matplotlib.rcParams['font.family'] = 'AppleGothic'    # 맥북 '애플 고딕'설정

matplotlib.rcParams['axes.unicode_minus'] = False


<Before, After 설정>

members_id= ['m_01','m_02','m_03','m_04']
before_wo = [27,35,40,33]
after_wo = [30,38,42,37]


# plt.bar

# 세로막대기
import matplotlib.pyplot as plt
import numpy as np

n_data = len(members_id) # 4명
index_1 = np.arange(n_data) # Numpy 배열 (0,1,2,3)

plt.bar(index_1, before_wo, tick_label=members_id) # bar(x,y)에서 x=index, y= before_wo
plt.title('Before 세로막대기')
plt.show()


# 가로 막대 그래프를 생성
colors =['r','g','b','m']
plt.barh(index_1,after_wo, color=colors, tick_label = members_id)  # barh <- h만 넣어주면 됨
plt.title('After 세로막대기')
plt.show()


<2가지 세로막대기 생성으로 비교해보기>

# 하나의 창에서 두 개의 그래프를 그리자.
barwidth = 0.4
plt.bar(index_1,before_wo, color='c', align='edge', width=barwidth, label='before')
plt.bar(index_1+barwidth,after_wo, color='m', align='edge', width=barwidth, label='after')
plt.legend() # 범례
plt.xlabel('회원 ID')
plt.ylabel('근육량')
plt.title('운동 전후의 근육변화량 비교')
plt.show()


'AI > [Visualization]' 카테고리의 다른 글

[Seaborn] Seaborn 그래프 형태  (0) 2023.02.13
[Matplotlib] Pie그래프  (0) 2023.02.13
[Matplotlib] 산점도 찍기  (0) 2023.02.13
[Matplotlib] 시각화 첫 단계  (0) 2023.02.07
# 한국어 폰트 적용

import matplotlib
# matplotlib.rcParams['font.family'] = 'Malgun Gothic' # 윈도우즈의 '맑은 고딕'설정
matplotlib.rcParams['font.family'] = 'AppleGothic'    # 맥북 '애플 고딕'설정

matplotlib.rcParams['axes.unicode_minus'] = False


import matplotlib.pyplot as plt
import numpy as np
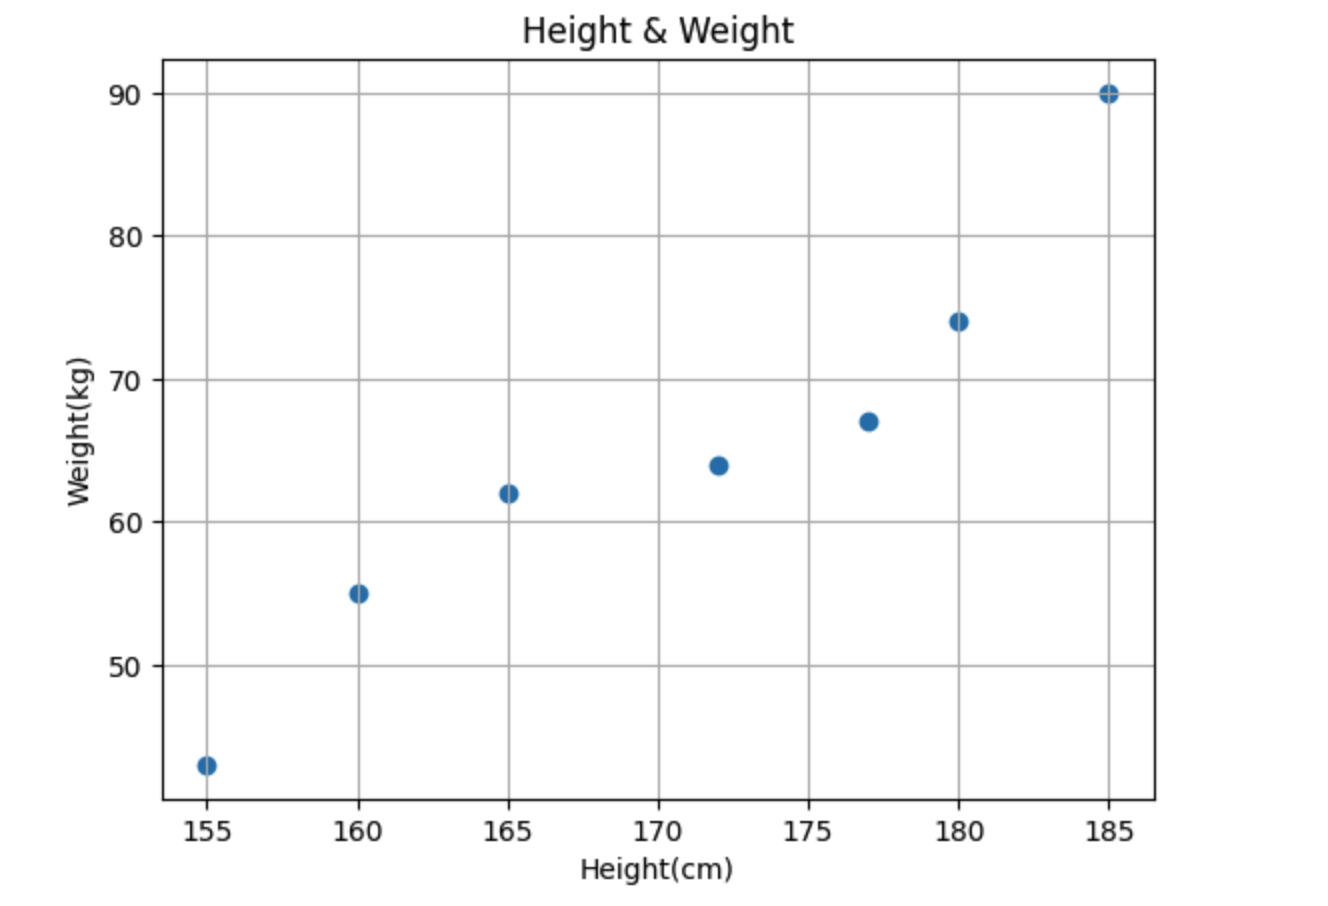
height = [165,177,160,180,185,155,172] # 키 데이터
weight = [62,67,55,74,90,43,64] # 몸무게 데이터
plt.scatter(height, weight)

plt.xlabel('Height(cm)')
plt.ylabel('Weight(kg)')
plt.title('Height & Weight')
plt.grid()  # 그리드

plt.scatter(height, weight, s=500, c='r') # s: 마커크기, c: 색

plt.show()


# 마커 크기를 변경하는 방법

plt.scatter(height, weight, s=500, c='r') # s: 마커 크기, c: 색깔
plt.show()


# 데이터마다 마커의 크기와 컬러를 다르게 지정

size = 100* np.arange(1, 8)
colors = ['r', 'g', 'b', 'c', 'm', 'k','y'] 
plt.scatter(height, weight, s=size, c=colors)
height = [165,177,160,180,185,155,172] # 키 데이터
weight = [62,67,55,74,90,43,64] # 몸무게 데이터       # 165, 62가 1번째 Red -> 177, 67 Green 순서대로
plt.show()


https://hyunmin1906.tistory.com/30


import numpy as np

city = ['서울','인천','대전','대구','울산','부산','광주']

# 위도(latitude)와 경도(longitude)
lat = [37.56, 37.45, 36.35, 35.87, 35.53, 35.18, 35.16]
lon = [126.97, 126.70, 127.38, 128.60, 129.31, 129.07, 126.85]

# 인구밀도
pop_den = [16154, 2751, 2839, 2790, 1099, 4454, 2995]

size = np.array(pop_den) * 0.2 # 마커의 크기 지정
colors = ['r','g','b','c','m','k','y'] # 마커의 컬러 지정

plt.scatter(lon, lat, s= size, alpha=0.5)
plt.xlabel('경도')
plt.ylabel('위도')
plt.title('지역별 인구밀도')

for x,y, city_name in zip(lon, lat,city):
    plt.text(x,y, city_name) # 경도, 위도에 따른 도시이름 mapping
    
    
plt.show()

'AI > [Visualization]' 카테고리의 다른 글

[Seaborn] Seaborn 그래프 형태  (0) 2023.02.13
[Matplotlib] Pie그래프  (0) 2023.02.13
[Matplotlib] 막대바  (0) 2023.02.13
[Matplotlib] 시각화 첫 단계  (0) 2023.02.07

교차 검증이 무엇인가요?

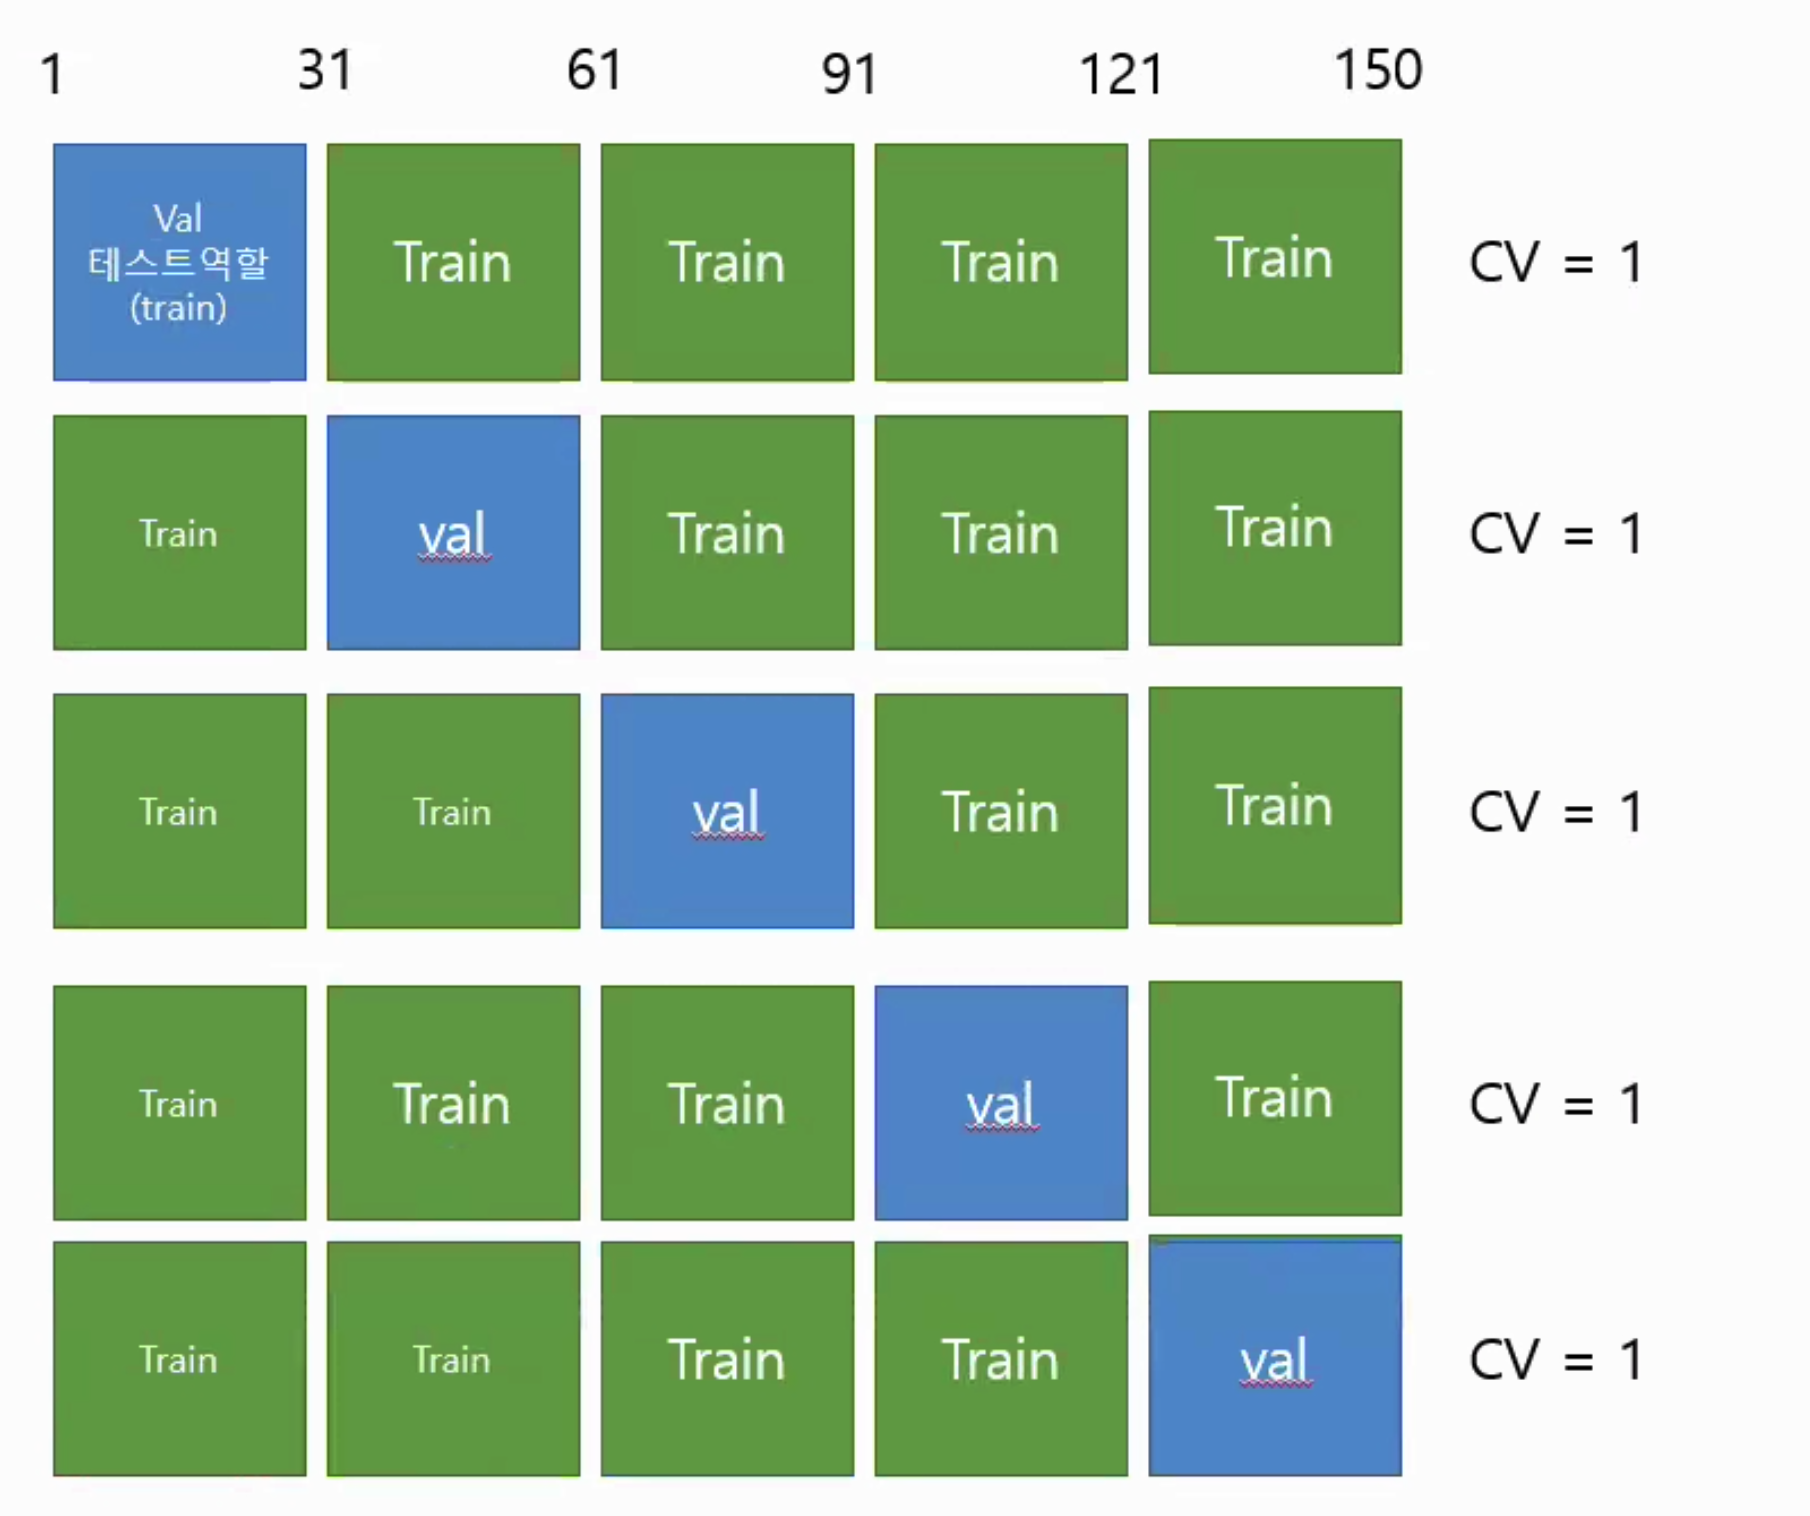
교차검증이란 모델 학습 시 데이터를 훈련용과 검증용으로 교차로 선택하는 방법


이전에 150개 중 120개만 데이터 훈련용, 30개를 검증용으로 사용했다면 단 1번만 훈련이 된다.


이를 보안하기 위하여 학습용 데이터 셋을 분할시켜 정확도를 올림.


00

예시로 150개의 자료가 있다면 대략 5등분 하여(유효한 수의 데이터셋을 유지한 채) 4 x Train(초록색)을 이용해서 학습을 시킨다음 1 x 검증용(파란색) 데이터로 정확도를 측정을 총 5번 반복해서 진행하는 과정이다.


교차 검증 왜 하나요?


장점 

  • 특정 데이터셋에 대한 과적합 방지
  • 더욱 일반화된 모델 생성 가능
  • 데이터셋 규모가 적을 시 과소적합 방지


단점

  • 학습 및 검증에 필요한 시간이 증가


코드를 통하여서 알아보자.


1. 주요 라이브러리 임포트

# 필수 라이브러리 호출


from sklearn.datasets import load_iris   # 품종 데이터셋
from sklearn.tree import DecisionTreeClassifier   # 의사결정나무 알고리즘
from sklearn.model_selection import KFold    # 교차검증 자료 나누기
from sklearn.metrics import accuracy_score as acc_sc   # 평가지표
from sklearn.model_selection import train_test_split   # 훈련, 검증용 자료 나누기

import numpy as np
import pandas as pd

2. 데이터 불러오기

# 데이터 재정의
iris = load_iris()
features = iris.data # X값
label = iris.target # y값
dt_clf = DecisionTreeClassifier(random_state=156)

# kfold에서 k= 5로 놓자. (5등분한다)
kfold = KFold(n_splits=5)


print('데이터 셋의 크기:', features.shape[0])

# 데이터 셋의 크기: 150


3. 학습 수행 

n_iter = 0
cv_accuracy = []  # CV : cross validation
for train_index, val_index in kfold.split(label):
    # Kfold.split()으로 반환된 인덱스를 통해 학습용, 검증용 데이터 정의
    X_val, X_train = features[val_index], features[train_index]
    y_val, y_train = label[val_index], label[train_index]
    # 각 CV별 학습 및 예측
    dt_clf.fit(X_train,y_train) # 학습
    pred = dt_clf.predict(X_val) # 예측
    # 정확도 지표 계산
    accuracy = np.round(acc_sc(y_val, pred),3)
    train_size = X_train.shape[0]
    val_size = X_val.shape[0]
    n_iter += 1
    print(f'\n #{n_iter} CV 정확도:{accuracy}, 학습데이터 크기:{train_size}, 검증데이터 크기 : {val_size}')
    print(f'#{n_iter} 검증 데이터셋 인덱스 :{val_index}')
    cv_accuracy.append(accuracy)
    
# 개별 iteration 별 정확도 평균내기
print(f'\n ## 평균 CV정확도 :{np.mean(cv_accuracy)}')

<정확표 값>


 #1 CV 정확도:1.0, 학습데이터 크기:120, 검증데이터 크기 : 30
#1 검증 데이터셋 인덱스 :[ 0  1  2  3  4  5  6  7  8  9 10 11 12 13 14 15 16 17 18 19 20 21 22 23
 24 25 26 27 28 29]

 #2 CV 정확도:0.967, 학습데이터 크기:120, 검증데이터 크기 : 30
#2 검증 데이터셋 인덱스 :[30 31 32 33 34 35 36 37 38 39 40 41 42 43 44 45 46 47 48 49 50 51 52 53
 54 55 56 57 58 59]

 #3 CV 정확도:0.867, 학습데이터 크기:120, 검증데이터 크기 : 30
#3 검증 데이터셋 인덱스 :[60 61 62 63 64 65 66 67 68 69 70 71 72 73 74 75 76 77 78 79 80 81 82 83
 84 85 86 87 88 89]

 #4 CV 정확도:0.933, 학습데이터 크기:120, 검증데이터 크기 : 30
#4 검증 데이터셋 인덱스 :[ 90  91  92  93  94  95  96  97  98  99 100 101 102 103 104 105 106 107
 108 109 110 111 112 113 114 115 116 117 118 119]

 #5 CV 정확도:0.733, 학습데이터 크기:120, 검증데이터 크기 : 30
#5 검증 데이터셋 인덱스 :[120 121 122 123 124 125 126 127 128 129 130 131 132 133 134 135 136 137
 138 139 140 141 142 143 144 145 146 147 148 149]

 ## 평균 CV정확도 :0.9


cv_accuracy

# [1.0, 0.967, 0.867, 0.933, 0.733]


'AI > [ML]' 카테고리의 다른 글

[ML] 머신러닝 분류  (0) 2023.03.30
[ML] Scikit-learn 을 활용한 붓꽃 품종 예측하기  (0) 2023.02.08

Scikit-learn 을 활용한 붓꽃 품종 예측하기


sepal length, sepal , petal length, petal width를 통해서 label (품종)을 예측해보자

쉽게 말해서:  4개의 꽃의 특성을 구분한 150개의 자료가 있다.

특징1, 특징2....특징4(독립변수)와 거기에 맞는 품종이 표시된 120개의 데이터(특징 + 품종)를 이용하여 학습을 시킨 다음에 

나머지 30개의 특징만으로 그 특징에 맞는 품종을 예측을 하려고 한다.


어렵게 말하면 4개의 독립변수(특징)와 1개의 종속변수(품종)를 가지는 150개의 데이터를 가지고

120개는 훈련용 (4개의 독립변수 + 1개 종속변수) 

30개는 (4개의 독립변수) 검증용으로  1개의 종속변수 예측하기 :


어렵게 말하면 4개의 독립변수와 1개의 종속변수를 가지는 150개의 데이터를 가지고 1개의 종속변수 예측하기 :


scikit-learn 

# conda 가상환경시
#!conda install scikit-learn

!pip install scikit-learn


import sklearn 
import pandas as pd
import numpy as np
from sklearn.datasets import load_iris
from sklearn.tree import DecisionTreeClassifier
from sklearn.model_selection import train_test_split

print(sklearn.__version__) # 사이킷런 버전확인


#붓꽃 데이터 세트를 로딩
iris=load_iris()

#iris.data는 Iris 데이터 세트에서 피처(feature)만으로 된 데이터를 numpy로 가지고 있음.
iris_data=iris.data # x값 들

#iris.target은 붓꽃 데이터 세트에서 레이블(결정 값)데이터를 numpy로 가지고 있다.
iris_label=iris.target #y값 들
print('iris target값:', iris_label)
print('iris target명:', iris.target_names) # ['setosa' 'versicolor' 'virginica'] 문자타입을 0, 1, 2숫자로 변환!

#붓꽃 데이터 세트를 자세히 보기 위해 DataFrame으로 변환한다.
iris_df = pd.DataFrame(iris_data,columns=iris.feature_names)
iris_df['label']=iris.target
iris_df.tail()
iris target값: [0 0 0 0 0 0 0 0 0 0 0 0 0 0 0 0 0 0 0 0 0 0 0 0 0 0 0 0 0 0 0 0 0 0 0 0 0
 0 0 0 0 0 0 0 0 0 0 0 0 0 1 1 1 1 1 1 1 1 1 1 1 1 1 1 1 1 1 1 1 1 1 1 1 1
 1 1 1 1 1 1 1 1 1 1 1 1 1 1 1 1 1 1 1 1 1 1 1 1 1 1 2 2 2 2 2 2 2 2 2 2 2
 2 2 2 2 2 2 2 2 2 2 2 2 2 2 2 2 2 2 2 2 2 2 2 2 2 2 2 2 2 2 2 2 2 2 2 2 2
 2 2]
iris target명: ['setosa' 'versicolor' 'virginica']

# 0 : sentosa
# 1 : versicolor
# 2 : virginica

다음으로 학습용 데이터와 테스트용 데이터를 분리해보자. 학습용 데이터와 테스트용 데이터는 반드시 분리해야 한다.

학습데이터로 학습된 모델이 얼마나 뛰어난 성능을 가지는지 평가하려면 테스트 데이터 세트가 필요하기 때문이다.

이를 위해 사이킷런은 train_test_split()API를 제공한다. train_test_split()을 이용하면 학습 데이터와 테스트 데이터를 test_size 파라미터 입 값의 비율로 쉽게 분할이 가능하다. 예를 들어 test_size =0.2로 입력 파라미터를 설정하면 전체 데이터 중 테스트 데이터가 20%, 학습데이터가 80%로 데이터를 분할한다. 먼저 train_test_split()을 호출한 후 좀 더 자세히 입력 파라미터와 변환값을 살펴보자.


X_train, X_test, y_train, y_test = train_test_split(iris_data, iris_label, test_size=0.2) 
# test_size=0.2 = 20프로는 테스트용이로 따로 빼두겠다


X_train.shape # (sepal length, sepal width, petal length, petal width)
# (120, 4)   120가지의 4개의 컬럼을 가지고 있고 이것을 학습용 x (독립 변수로 두겠다)

y_train.shape # (label => 품종이 어떤건지)
(120,)	     120가지의 품종이 있다 (종속 변수) 


# X_train의 4가지 독립변수들을 결합하여 y_train 종속 변수를 찾아내는 알고리즘을 학습시킴


# 그 알고리즘에 

X_test.shape # (sepal length, sepal width, petal length, petal width)
# (30, 4)   30가지의 4개의 컬럼을 직접 넣어서 

y_test.shape 
# (30,)      30개의 품종을 얼마나 잘 맞추는지 테스트하는것!


의사결정나무를 통해서 학습시키기

# 의사결정 트리에  120개의 학습용 데이터 넣기

DecisionTreeClassifier.fit(X_train,y_train)
#학습이 완료된 DecisionTreeClassifier 객체에서 테스트 데이터 세트로 예측 수행.

pred=dt_clf.predict(X_test) # X_test는 test_size=0.2에서 빼둔 (30, 4)개의 데이터


# 예측값
pred

# array([2, 2, 1, 1, 2, 0, 1, 0, 0, 1, 1, 1, 1, 2, 2, 0, 2, 1, 2, 2, 1, 0,
#       0, 1, 0, 0, 2, 1, 0, 1])


# 실제값
y_test

# array([2, 2, 2, 1, 2, 0, 1, 0, 0, 1, 2, 1, 1, 2, 2, 0, 2, 1, 2, 2, 1, 0,
#       0, 1, 0, 0, 2, 1, 0, 1])

예측값(학습된 데이터로 만들어진 알고리즘) 30개중 2개가 실제값과 다름

정확도 : 0.93333

from sklearn.metrics import accuracy_score as acc_sc
print('예측 정확도: {0}'.format(acc_sc(y_test,pred)))


학습한 의사 결정 트리의 알고리즘 예측 정확도가 약 0.9333(93.33%)으로 측정되었다. 앞의 붓꽃 데이터 세트로 분류를 예측한 프로세스를 정리하면 다음과 같다.

  1. 데이터 세트 분리: 데이터를 학습 데이터와 테스트 데이터로 분리한다.
  2. 모델 학습: 학습 데이터를 기반으로 ML 알고리즘을 적용해 모델을 학습시킨다.
  3. 예측 수행: 학습된 ML 모델을 이용해 테스트 데이터의 분류 (즉, 붓꽃 종류)를 예측한다.
  4. 평가: 이렇게 예측된 결과 값과 테스트 데이터의 실제 결과를 비교해 ML 모델 성능을 평가한다.

'AI > [ML]' 카테고리의 다른 글

[ML] 머신러닝 분류  (0) 2023.03.30
[ML] 2. Cross Validation 교차 검증  (0) 2023.02.09

Matplotlib를 통한 시각화 첫 단계 

# matplotlib
!pip install matplotlib # 라이브러리 설치


import matplotlib.pyplot as plt # 라이브러리 임포트


값 채워 넣고 라이브러리 실행 (1차식)

data1 = [10,14,19,20,25]
plt.plot(data1)
plt.show()


2차식 넘파이를 활용하여 만들기

import numpy as np 
x = np.arange(-4.5, 5, 0.5) # 넘파이로 숫자 생성(-4.5 부터 5까지 0.5씩증가)
y = 2*x**2   # y = 2x^2
[x,y]


#[array([-4.5, -4. , -3.5, -3. , -2.5, -2. , -1.5, -1. , -0.5,  0. ,  0.5,
#         1. ,  1.5,  2. ,  2.5,  3. ,  3.5,  4. ,  4.5]),
# array([40.5, 32. , 24.5, 18. , 12.5,  8. ,  4.5,  2. ,  0.5,  0. ,  0.5,
#         2. ,  4.5,  8. , 12.5, 18. , 24.5, 32. , 40.5])]

시각화하기 

plt.plot(x,y)
plt.show()


여러 그래프를 하나의 창에 넣어보기

# 함수 설정하기
import numpy as np
import matplotlib.pyplot as plt

x = np.arange(-4.5, 5.0, 0.5)
y1 = 2*x**2
y2 = 5*x + 30
y3 = 4*x**2 + 10


# 시각화 방법 1
plt.plot(x,y1)
plt.plot(x,y2)
plt.plot(x,y3)
plt.show()

# 더 간단하게도 가능
#plt.plot(x,y1,x,y2,x,y3)
# plt.show()


여러 그래프를 여러 창에 넣어보기

# 넘파이로 함수 생성
import numpy as np

# 데이터 생성
x = np.arange(-5,5, 0.1)
y1 = x**2 -2

y2 = 20*np.cos(x)**2

#plt.figure 로 새창을 만들고 (숫자)로 여러 창 생성가능

plt.figure(1) # 1번 그래프를 창에 넣기
plt.plot(x, y1)

plt.figure(2) # 2번 그래프를 창에 넣기
plt.plot(x, y2)

plt.show()

'AI > [Visualization]' 카테고리의 다른 글

[Seaborn] Seaborn 그래프 형태  (0) 2023.02.13
[Matplotlib] Pie그래프  (0) 2023.02.13
[Matplotlib] 막대바  (0) 2023.02.13
[Matplotlib] 산점도 찍기  (0) 2023.02.13
import pandas as pd
df = pd.DataFrame({'Old A' : ['Old a1', 'Old a2', 'Old a3', 'Old a4'], 'Old B' : ['Old b1', 'Old b2', 'Old b3', 'Old b4'], 'Old C' : ['Old c1', 'Old c2', 'Old c3', 'Old c4']})
df

1. 인덱스 명 바꾸기


  • 1-1 df.index = ["바꿀 인덱스 값"]

# 모든 인덱스를 바꿀때만 

# 이미 생성된 컬럼수와 입력하는 컬럼수가 같아야함
df.index = ["New 0", "New 1", "New 2", "New 3"]
df


  • 1- 2 df.rename(columns = {"원래이름" : "바꿀이름" }, option)   

(일부의 인덱스명만 바꿀때 and 인덱스명으로)

 * rename의 파라미터인 딕셔너리 형태로 써줌

# 일부의 인덱스명만 바꿀때 and 인덱스명으로
df.rename(index = {0: "New 0", 1: "New 1"}) 
# df.rename({0: "New 0", 1: "New 1"}, axis =0)

# axis= 0 은 인덱스  (생략도 가능)


option : inplace = True (기존값도 변경)   


  • 1-3 df.index.values[컬럼번호] = "바꿀 컬럼명" 

(일부의 컬럼명만 바꿀때 and 컬럼명으로)

# 일부의 인덱스명만 바꿀때 and 인덱스 번호로
df.index.values[0] = "New A0"


오류발생 !!

# 'int' object has no attribute 'index'
# invalid literal for int() with base 10: 'New A0'


  • 1-4 컬렴을(열)을 인덱스로 만들기
df1 = df.set_index("Old A")
df1


2.  컬럼명 명 바꾸기

-> 인덱스랑 똑같다. 'Index 대신 'columns'로 바꾸면 끝


  • 1- 1  df.column 을 통해서 바꾸기  

(모든 컬럼명을 바꿔야 할때만)

* column 의 파라미터인 리스트형태로 써줌

df.columns = ["New A", "New B", "New C"] # 이미 생성된 컬럼수와 입력하는 컬럼수가 같아야함
df


  • 1- 2 df.rename(columns = {"원래이름" : "바꿀이름" }, option)   

(일부의 컬럼명만 바꿀때 and 컬럼명으로)

 * rename의 파라미터인 딕셔너리 형태로 써줌

# 일부의 컬럼명만 바꿀때 and 컬럼명으로
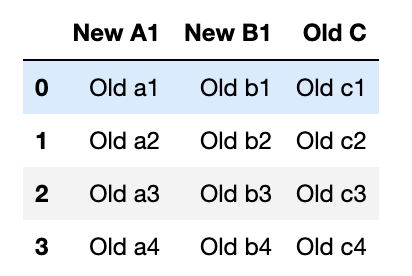
df.rename(columns = {"Old A": "New A1", "Old B": "New B1"}) 
# df.rename({"Old A": "New A1", "Old B": "New B1"}, axis =1)

# axis= 1 은 컬럼(열)

# rename() 함수에서는 lambda 사용가능
df.rename(columns= lambda x:'[' + x +']' )


option : inplace = True (기존값에 저장)   


  • 1-3 df.columns.values[컬럼번호] = "바꿀 컬럼명" 

(일부의 컬럼명만 바꿀때 and 컬럼명으로)

# 일부의 컬럼명만 바꿀때 and 컬럼 번호로
df.columns.values[0] = "New A1"


3.  데이터 값 변경

CRUD에서 R과 똑같음

https://itcreator.tistory.com/143

# https://itcreator.tistory.com/143    3-1번 

titan_df.loc[0,'Pclass']  # 3이 출력됐었음

# " = " 만 넣으면 끝
titan_df.loc[0,'Pclass'] = 999999  # 3에서 999999로 바뀜


4. 조건으로 데이터 값 변경하기 

- lamda

# st['default'] = st['default'].apply(lambda x : 0 if x == 'No' else 1)
# st


5. replace

df.replace('현재 문자열', '바꿀 문자열', inplace = True) # inplace = True : 원본도 바꿈


# 여러개 바꿀때는 Key-Value 형태로 가능 
df.replace({'현재 문자열1':'바꿀 문자열 1', '현재문자열2':' 바꿀 문자열 2'})


# 하나의 컬럼에서 바꿀때
df.replace({'컬럼이름': {'찾을 문자열': '대체 문자열'}}

+ Recent posts